Consumer Staples Like P&G Are Surging. Does That Foreshadow A Recession?
Submitted by Silverlight Asset Management, LLC on August 1st, 2019
Procter & Gamble (P&G) just reported its best organic sales result in over a decade. The Cincinnati-based maker of everyday consumer goods saw revenue rise 7%, bolstered by pricing and market share gains in the company's health care segment.
“Overall, we can’t emphasize enough how impressive the top-line was this quarter, with P&G proving it is one of the best growth stories in large-cap staples,” wrote Wells Fargo analyst Bonnie Herzog.
P&G shares rose over 3% yesterday, and are up 31% in 2019.
Several other consumer staples stocks are also exhibiting positive momentum lately.
Take Coca-Cola, whose shares jumped 6% last week. The beverage giant beat earnings estimates and raised its organic revenue forecast for 2019 to 5% from 4%.
In February, I wrote a piece highlighting the investment merits for Hershey. Like P&G, that company has recently been able to flex pricing power and eclipse analyst expectations. The stock is up 42% since Valentine's Day.
Few would dispute that P&G, Coke and Hershey are great American companies. However, absent M&A deals, it’s unusual for stocks like these to surge this far this fast.
Remember, these aren’t disruptive companies lighting the world on fire with their growth rates. Rather, these are companies growing earnings between 6%-8%.
So, given the recent pace of gains, it’s right to wonder if the valuations of these stocks are getting ahead of themselves?
JPMorgan’s widely followed strategist Marko Kolanovic recently called the performance divergence of low-volatility stocks and value stocks “more significant than any relative valuation bubble” in modern history.
Based on the average valuations (trailing 5-years) for the previously mentioned names, it appears Kolanovic may have a point.
- P&G trades at a forward P/E of 25.2 versus a 20.3 historical average
- Coke trades at a forward P/E of 24.3 versus a 21.4 historical average
- Hershey trades at 25.5 forward P/E versus a 20.9 historical average
I think trimming these stocks makes sense and have reduced my position in Hershey.
There’s another important signal this sector may be sending, however, regarding the bigger picture setup for the market.
When Staples Rally, It’s Often Time To Ring The Register On The Market
When consumer staples valuations levitate higher in a hurry, it often foreshadows an economic slowdown around the corner. Money tends to flow to safe haven sectors before fleeing the market entirely.
Ten years ago, when I was an equity analyst, I co-authored a book about the consumer staples sector. A key topic we highlighted was the important relationship between the consumer staples and consumer discretionary sectors.
The lifeblood of the American economy is the U.S. consumer. Consumers are responsible for roughly two thirds of GDP.
Consumer demand for discretionary items fluctuates based on the ebb and flow of the economy, while demand for items like the laundry detergent P&G sells is a more permanent part of the average consumer’s budget. So when consumer spending is projected to ramp, investors often overweight the consumer discretionary sector in their portfolio, while going underweight staples.
Since markets discount the future, the relative performance rhythm of staples versus discretionary can be used as a barometer for the market’s assessment of economic risk.
Discretionary outperforming is a confirmation signal for a bull market. It tells you the wisdom of the crowd (i.e., the market) projects healthy earnings for a key cyclical sector.
On the other hand, when staples are outperforming at an all-time market high—as is presently the case—the durability of a bull market is questionable.
Defensive sectors normally trade at a premium as the risk of a recession rises, because forward-looking investors know the earnings in those sectors are likely to contract less in a downturn. The last cycle provides a case study for how this works.
Staples commanded a higher P/E multiple than discretionary in 2007. But over the following year, staples saw earning-per-share grow 19%, whereas discretionary earnings plummeted into the red.

Data Source: Bloomberg
The stark contrast in fundamentals manifested in very different return profiles, as staples fell a lot less than discretionary in 2008 (–15.4% vs. –33.5%).
Below is an illustration of the relative price action of these two sectors over the previous two cycles. Staples began to outperform discretionary in early 2000 (red line rising), shortly before a recession arrived (vertical pink bar). Similarly, staples outperformed in 2007 in the lead up to the last U.S. recession.

S&P 500 Consumer Staples vs. S&P 500 Consumer Discretionary alongside a recession probability indicator.
Since 2009, consumer discretionary has trounced staples in relative performance. In the second-half of last year, though, the relative ratio formed a double-bottom at a support level that dates back to the spring of 2000. Meanwhile, the New York Fed’s Probability of Recession Index (blue line) has recently been spiking higher.
Perhaps we’re closer to the next recession than many think?
Jeffrey Gundach of DoubleLine Capital, a.k.a. “The Bond King,” estimates the odds of the U.S. sliding into recession in the next year at 65%.
If Gundlach is right, consumer staples stocks may not go up much more on an absolute basis. But recession resistant firms could still see a lot more relative outperformance. That would mean they aren’t the real problem children in the average investor’s portfolio right now.
Last month, I wrote a Forbes piece describing the utility of certain technical indicators. Specifically, I prefer those that measure when an existing trend may be about to end. I’ve found the DeMark indicators to be one of the best tools for anticipating trend reversals.
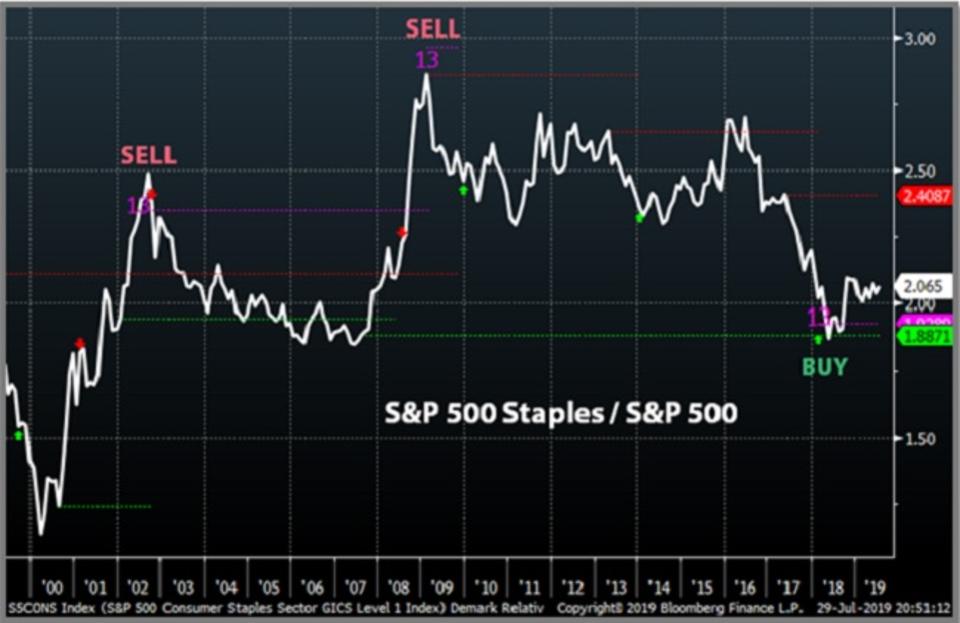
Below is a monthly chart of the relative ratio of the Consumer Staples sector against the S&P 500, along with an indicator called TD Combo. Magenta 13s identify levels where price flips are probable.

Staples relative performance vs SPX
The last 13 was a buy signal since the existing trend was down. It appeared near the point where staples bottomed last year in relative performance terms. If that bottom holds, the new bullish trend could have a long runway (i.e., staples could outperform a lot more).
U.S. retailers face tough earnings comps in the coming months.
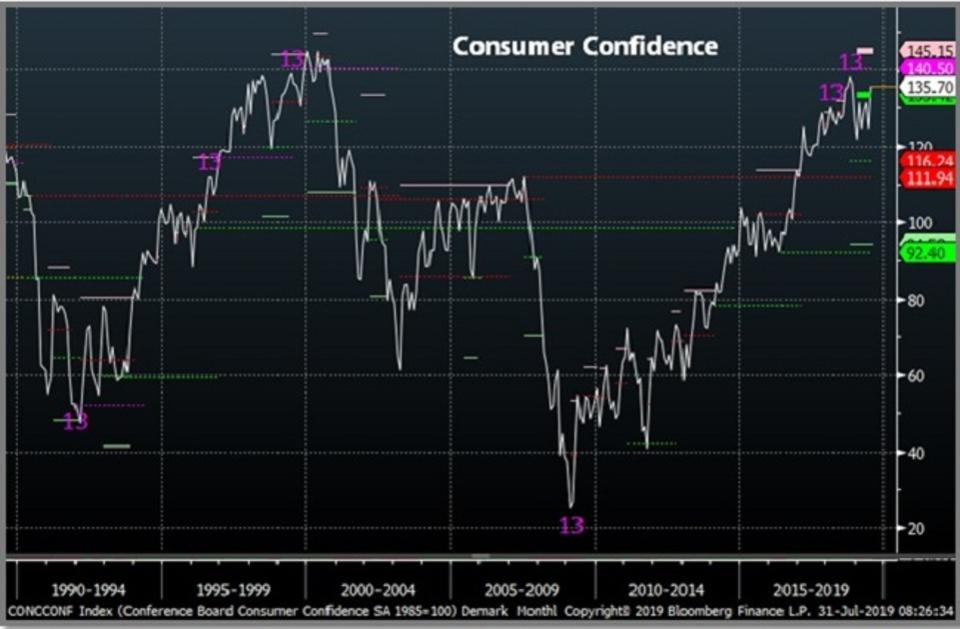
Meanwhile, consumer confidence is at a high level where there's normally more downside potential than upside. Similar to the previous chart, TD Combo has nailed several key inflections in this economic data series over the last 30 years.

Consumer Confidence Index. Sources: Conference Board, Bloomberg, DeMark Analytics.
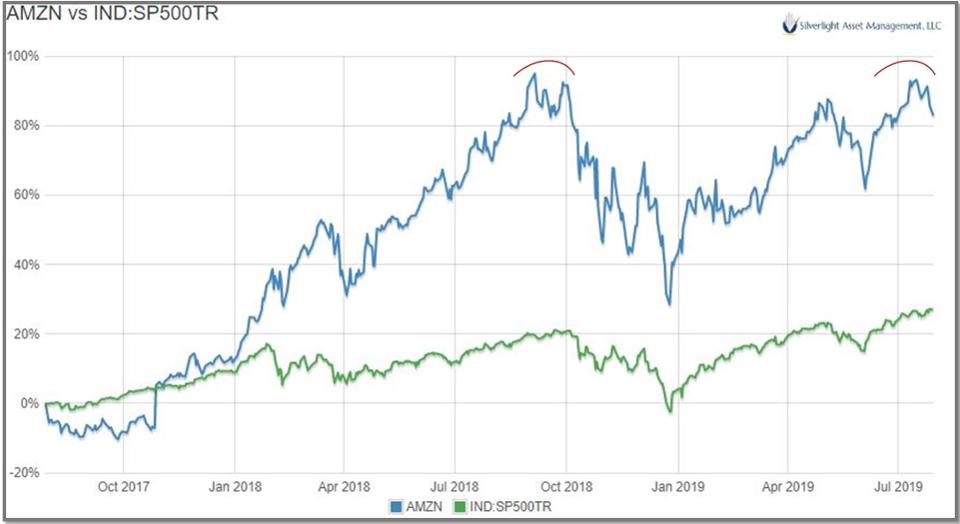
Finally, the biggest consumer discretionary name of all, Amazon, recently reported disappointing earnings. And for now at least, Amazon has formed what looks like a double top. Not an encouraging technical setup for a stock where Wall Street has 52 Buy ratings, 2 Holds, and zero Sells.

Amazon's relative performance versus the S&P 500.
Amazon is a “Market General” that's led this bull market. Watch that stock closely, whether you own it or not.
As long as P&G keeps making new highs, while Amazon fails to, discretion is the better part of valor.
Originally published by Forbes. Reprinted with permission.
Disclosure: I own shares of Hershey in accounts I professionally manage. This material is not intended to be relied upon as a forecast, research or investment advice. The opinions expressed are as of the date indicated and may change as subsequent conditions vary. The information and opinions contained in this post are derived from proprietary and nonproprietary sources deemed by Silverlight Asset Management LLC to be reliable, are not necessarily all-inclusive and are not guaranteed as to accuracy. As such, no warranty of accuracy or reliability is given and no responsibility arising in any other way for errors and omissions (including responsibility to any person by reason of negligence) is accepted by Silverlight Asset Management LLC, its officers, employees or agents. This post may contain “forward-looking” information that is not purely historical in nature. Such information may include, among other things, projections and forecasts. There is no guarantee that any of these views will come to pass. Reliance upon information in this post is at the sole discretion of the reader.
Testimonials Content Block
More Than an Investment Manager—A Trusted Guide to Financial Growth
"I’ve had the great pleasure of having Michael as my investment manager for the past several years. In fact, he is way more than that. He is a trusted guide who coaches his clients to look first at life’s bigger picture and then align their financial decisions to support where they want to go. Michael and his firm take a unique and personal coaching approach that has really resonated for me and helped me to reflect upon my core values and aspirations throughout my investment journey.
Michael’s focus on guiding the "why" behind my financial decisions has been invaluable to me in helping to create a meaningful strategy that has supported both my short-term goals and my long-term dreams. He listens deeply, responds thoughtfully, and engages in a way that has made my investment decisions intentional and personally empowering. With Michael, it’s not just about numbers—it’s about crafting a story of financial growth that has truly supports the life I want to live."
-Karen W.
Beyond financial guidance!
"As a long-term client of Silverlight, I’ve experienced not only market-beating returns but also invaluable coaching and support. Their guidance goes beyond finances—helping me grow, make smarter decisions, and build a life I truly love. Silverlight isn’t just about wealth management; they’re invested in helping me secure my success & future legacy!"
-Chris B.
All You Need Know to Win
“You likely can’t run a four-minute mile but Michael’s new book parses all you need know to win the workaday retirement race. Readable, authoritative, and thorough, you’ll want to spend a lot more than four minutes with it.”
-Ken Fisher
Founder, Executive Chairman and Co-CIO, Fisher Investments
New York Times Bestselling Author and Global Columnist.
Packed with Investment Wisdom
“The sooner you embark on The Four-Minute Retirement Plan, the sooner you’ll start heading in the right direction. This fun, practical, and thoughtful book is packed with investment wisdom; investors of all ages should read it now.”
-Joel Greenblatt
Managing Principal, Gotham Asset Management;
New York Times bestselling author, The Little Book That Beats the Market
Great Full Cycle Investing
“In order to preserve and protect your pile of hard-earned capital, you need to be coached by pros like Michael. He has both the experience and performance in The Game to prove it. This is a great Full Cycle Investing #process book!”
-Keith McCullough
Chief Executive Officer, Hedgeye Risk Management
Author, Diary of a Hedge Fund Manager
Clear Guidance...Essential Reading
“The Four-Minute Retirement Plan masterfully distills the wisdom and experience Michael acquired through years of highly successful wealth management into a concise and actionable plan that can be implemented by everyone. With its clear guidance, hands-on approach, and empowering message, this book is essential reading for anyone who wants to take control of their finances and secure a prosperous future.”
-Vincent Deluard
Director of Global Macro Strategy, StoneX

