Supply-Driven Themes
Submitted by Silverlight Asset Management, LLC on February 28th, 2017
What makes stock prices move up or down are not events, fundamentals, or valuations. These factors matter, but only at the margin. What really moves stock prices is the interplay of supply and demand.
The laws of supply and demand explain why original Beatles vinyl records and Picassos are worth so much. Both artists enjoy timeless adoration from all kinds of people, but there is only a finite number of records and paintings available to buy. When you have nearly endless demand with fixed supply, it will almost always support higher prices.
The opposite is also true—paper clips and hair dryers are cheap, because they are undifferentiated and millions proliferate people’s homes everywhere. Supply easily keeps up with (and sometimes exceeds) demand, keeping prices relatively low.
While the theory of supply and demand is a widely-known idea, it is poorly understood in relation to security pricing. Like with any good or service, equity trades are transactions that involve buyers and sellers. And when buyers and sellers transact in a free market, the laws of supply and demand set prices. Specifically, security prices reflect how eager buyers and sellers are in relation to one another.
Demand drives short-term pricing rhythms in the stock market and shapes the tenor of financial media. “Stocks Decline on Weak Jobs Number,” may be a headline. Or, “Trump Tweet Sparks Selloff in Boeing Shares.” These are stories that trigger short-term demand fluctuations as the market reacts and investor sentiment changes.
Supply gets less airtime because it is not as newsworthy—the broad supply of public equity shares changes very little in the short run. Watching share count as an indicator is a little like watching paint dry—don’t expect much action on any given day. Investors should not take this to mean supply lacks importance. It is hugely important, and investors must take a two-pronged approach to assessing supply when making investment decisions.
Supply Factor #1: Supply of Shares
Market bottoms are often a supply-driven phenomenon. Bull markets typically begin when sellers become exhausted (supply dries up). Rarely is positive news—a demand stimulant—associated with a key bottom.
A clue you are seeing a major bottom in a single stock, or the overall market, is when prices rise on bad news. That’s the best climate to buy-into by far. It means expectations are very low, which means risk is also low.
Conversely, increasing supply can play a causal role in ending a cycle. High supply means high expectations and risk. The Tech Bubble at the turn of the Millennium is a great example. Investors eagerly scooped up tech share offerings, driving rich valuations, which led to eager suppliers bringing an abundant flow of new offerings to market.
If some stock categories get too hot-and-pricey, mass supply is created via stock offerings to tap that cheap money - and, when overdone, drives it all down.
-Ken Fisher
Since 2009, the bull market has been accompanied by equity supply shrinkage. Cautious management teams have chosen to use excess cash flow to buy back shares in addition to paying dividends (which is the opposite of what occurred during the IPO boom that characterized the Tech Bubble). All else equal, fewer available shares are good for per-unit profits and share prices.
Behaviorally speaking, people tend to be myopic—meaning they focus disproportionate attention on short-term factors, and they underweight their attention to longer-term issues (i.e., investors generally tend to react more to demand drivers than supply drivers). Knowing this can be a source of great advantage to an investor. That’s why supply analysis is so powerful. It matters a lot, and few people pay attention to it.
Supply Factor #2: Actual Supply of the Good, Service, or Commodity
Investors also must take a close look at the physical and/or available supply of the good, service, or commodity that a company is in the business of providing and selling. To frame this in a way that’s easy to understand, here are two industry examples where supply analysis presently leads to opposite investment conclusions.
- Example of a Bullish Supply Setup: Housing
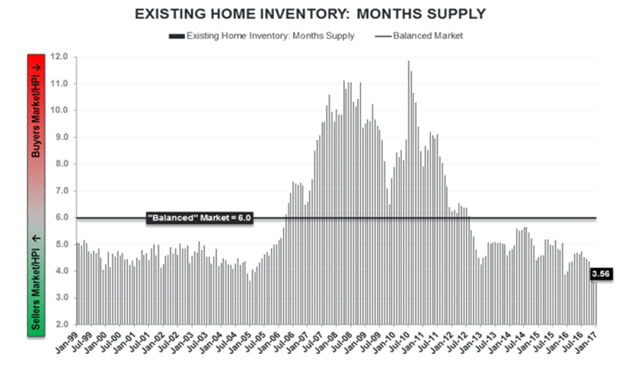
Housing supply is tight. Last week, existing home inventory declined to its lowest level ever. Months-supply are at 3.56 months. A normalized, ‘balanced’ market is considered about 6-months inventory. So, it’s a “Seller’s Market,” according to Hedgeye Research.

In addition to tight existing supply, new supply creation is tepid. Housing starts are trending up, but they are not far from cyclical lows.

The time to have been maximally bearish on housing was when housing starts and inventory were at high levels back in 2006-2007. Today, the supply picture is much healthier.
What about demand? Sales of existing homes rose 3.3% in January from the prior month. Sale rates are now approaching those of early 2007. The resiliency of the housing market remains a bright spot for the U.S. economic outlook.
Easier mortgage underwriting standards are also helping. For 11 straight quarters, mortgage lenders have reduced their loan approval standards as housing prices have recovered. Underwriting could get easier still as the Trump Administration dismantles Dodd-Frank regulation, loosening bank capital requirements.
Based on our assessment of overall conditions, Silverlight has a longer-term bullish bias toward the homebuilding sector and associated sub-industries.
- Example of a Bearish Supply Setup: Energy
We have exposure to every sector of the S&P 500 presently, except for one: We do not own a single Energy stock.
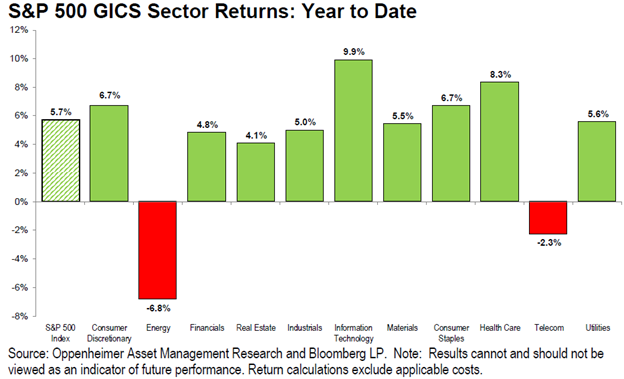
It’s early in the year for victory laps, but our extreme underweight to the Energy sector has worked very well so far. Energy stocks have lagged (a lot):

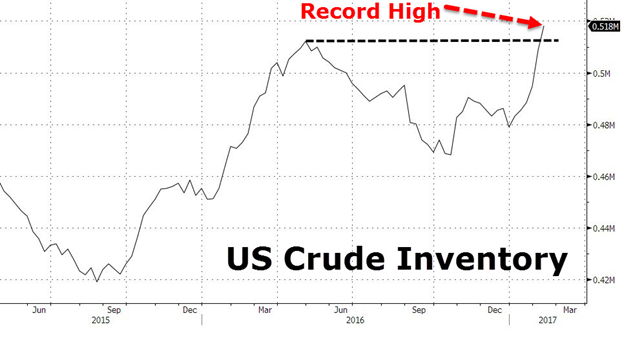
Unlike housing, the energy patch is awash in supply. Bloomberg data shows U.S. crude inventory at a record high:

When oil spiked over $100 a barrel in the last cycle, “peak oil” was a hot topic, as many experts in energy circles fretted about fossil fuel supplies running out.
It’s wild just how quickly and dramatically those perceptions have changed!
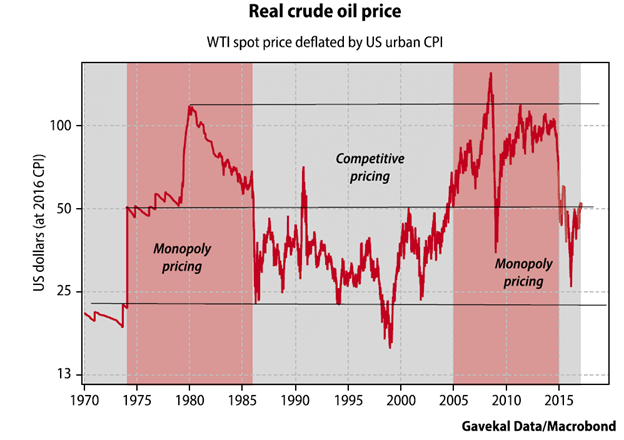
Interestingly, the cure for high commodity prices is often just that—high prices. Selling at a high price often means better profit margins, which spurs investment in technology and eventually increases supply. This leads to two types of ‘long-cycle’ phases, depicted in the chart below:

In “Monopoly” pricing environments, like 1975-1985 and 2005-2015, the $50 level acts as a floor for real crude oil prices. In ‘Competitive” phases like the 1990s and now, $50 is a ceiling.
The x-factor in the Energy sector that plays a bigger role today on supply than at any point in history is innovation. Technological advancement is continuing at a fast pace. Chesapeake Energy recently drilled a Louisiana natural gas well where new techniques allowed them to boost output by 70% compared to what would have been achieved using traditional fracking techniques a few years ago.
More sand is being used now to prop open bigger cracks in the rock for oil and gas to flow, and the length that wells are being drilled sideways underground has grown by 50%.
If oil went to $75, you can bet even more innovation would come into the fracking space.
Outside of innovation, there has been a major paradigm shift which effectively removes the supply-controls that have nearly always governed oil prices. The U.S. is now a swing producer. Petro-dictators and OPEC have been forced to sit idly by and endure falling oil prices over recent years, while U.S. frackers have tenaciously worked to find ways to extract ever more crude from shale formations for less money and in less time.
The problem for OPEC is U.S. production cannot be controlled. In the U.S., there are 10,000 independent entrepreneurs making production decisions. This is a dramatically different setup than a single petro-state like Saudi Arabia calling all the shots.
Adding to the influence of excess supply on future prices, the U.S. is set to remove the shackles from the frackers in a major way. The newly appointed head of the EPA, Scott Pruitt, is pro-fracking and wants to dramatically loosen environmental regulations. Like Pruitt, the Energy Secretary appointee, Texas Gov. Rick Perry, is a climate change skeptic and pro-oil.
Combine all of the above factors, and it is our view that the supply glut in Energy is likely to remain for some time. The production surge is good for American consumers, but may be cause for a ‘lost decade’ for energy investors.
This material is not intended to be relied upon as a forecast, research or investment advice, and is not a recommendation, offer or solicitation to buy or sell any securities or to adopt any investment strategy. The opinions expressed are as of the date indicated and may change as subsequent conditions vary. The information and opinions contained in this post are derived from proprietary and nonproprietary sources deemed by Silverlight Asset Management LLC to be reliable, are not necessarily all-inclusive and are not guaranteed as to accuracy. As such, no warranty of accuracy or reliability is given and no responsibility arising in any other way for errors and omissions (including responsibility to any person by reason of negligence) is accepted by Silverlight Asset Management LLC, its officers, employees or agents. This post may contain “forward-looking” information that is not purely historical in nature. Such information may include, among other things, projections and forecasts. There is no guarantee that any of these views will come to pass. Reliance upon information in this post is at the sole discretion of the reader.
The strategies discussed are strictly for illustrative and educational purposes and are not a recommendation, offer or solicitation to buy or sell any securities or to adopt any investment strategy. There is no guarantee that any strategies discussed will be effective.
Testimonials Content Block
More Than an Investment Manager—A Trusted Guide to Financial Growth
"I’ve had the great pleasure of having Michael as my investment manager for the past several years. In fact, he is way more than that. He is a trusted guide who coaches his clients to look first at life’s bigger picture and then align their financial decisions to support where they want to go. Michael and his firm take a unique and personal coaching approach that has really resonated for me and helped me to reflect upon my core values and aspirations throughout my investment journey.
Michael’s focus on guiding the "why" behind my financial decisions has been invaluable to me in helping to create a meaningful strategy that has supported both my short-term goals and my long-term dreams. He listens deeply, responds thoughtfully, and engages in a way that has made my investment decisions intentional and personally empowering. With Michael, it’s not just about numbers—it’s about crafting a story of financial growth that has truly supports the life I want to live."
-Karen W.
Beyond financial guidance!
"As a long-term client of Silverlight, I’ve experienced not only market-beating returns but also invaluable coaching and support. Their guidance goes beyond finances—helping me grow, make smarter decisions, and build a life I truly love. Silverlight isn’t just about wealth management; they’re invested in helping me secure my success & future legacy!"
-Chris B.
All You Need Know to Win
“You likely can’t run a four-minute mile but Michael’s new book parses all you need know to win the workaday retirement race. Readable, authoritative, and thorough, you’ll want to spend a lot more than four minutes with it.”
-Ken Fisher
Founder, Executive Chairman and Co-CIO, Fisher Investments
New York Times Bestselling Author and Global Columnist.
Packed with Investment Wisdom
“The sooner you embark on The Four-Minute Retirement Plan, the sooner you’ll start heading in the right direction. This fun, practical, and thoughtful book is packed with investment wisdom; investors of all ages should read it now.”
-Joel Greenblatt
Managing Principal, Gotham Asset Management;
New York Times bestselling author, The Little Book That Beats the Market
Great Full Cycle Investing
“In order to preserve and protect your pile of hard-earned capital, you need to be coached by pros like Michael. He has both the experience and performance in The Game to prove it. This is a great Full Cycle Investing #process book!”
-Keith McCullough
Chief Executive Officer, Hedgeye Risk Management
Author, Diary of a Hedge Fund Manager
Clear Guidance...Essential Reading
“The Four-Minute Retirement Plan masterfully distills the wisdom and experience Michael acquired through years of highly successful wealth management into a concise and actionable plan that can be implemented by everyone. With its clear guidance, hands-on approach, and empowering message, this book is essential reading for anyone who wants to take control of their finances and secure a prosperous future.”
-Vincent Deluard
Director of Global Macro Strategy, StoneX

