The Stock Market Has Risen After Every Midterm Election Since 1950
Submitted by Silverlight Asset Management, LLC on October 2nd, 2022
It’s easy for investors to be gloomy following a rough September in which the S&P 500 Index tumbled 9.2%. That marked the worst September showing since 2002, when the index fell by 11%.
Before you hit the panic ‘Sell Everything’ button, though, it’s worth considering at least one bullish catalyst on the horizon—voters head to the ballot box on November 8th.
The data is clear: Midterm elections are historically bullish for the stock market.
Midterm Election Cycles
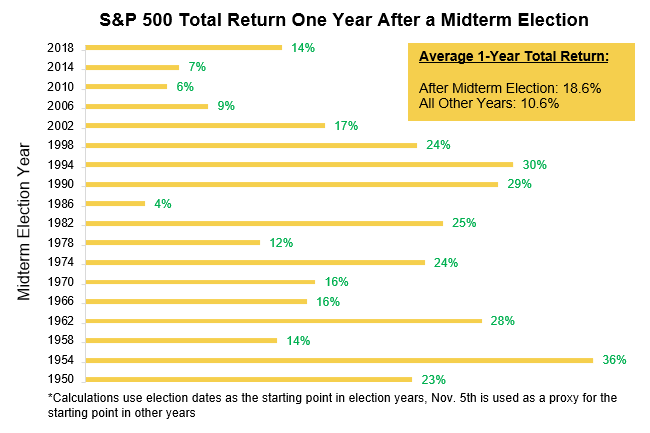
Since 1950, there have been 18 midterm election cycles, and in the twelve months following each of those cycles, the stock market has had positive returns.

Source: Bloomberg
US stocks have consistently earned positive returns after previous midterms, and delivered average annual returns of 18.6% compared to 10.6% in all other years.
Still feeling bearish? But wait, there’s more...
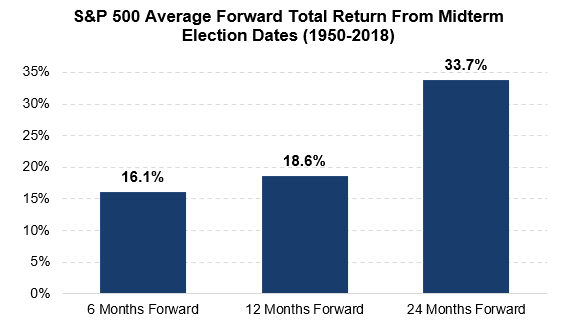
If we lookout two years after previous midterm elections, the average return has been a blistering 33.7%.

Source: Bloomberg
By now you may be wondering: Why are midterm elections such a bullish catalyst? Good question.
Why Stocks Tend To Rise After Midterms
Theories on the topic vary, but in my view the most compelling reason for why stocks tend to see above-average returns after midterms is because there’s a tendency for more gridlock in Washington following midterms. Investors think gridlock is good, because it means less legislative risk. And anytime there’s less macro uncertainty, it boosts investor sentiment.
Midterm elections typically bring a more divided government because the sitting President’s party rarely captures more seats in Congress. According to FiveThirtyEight, “One of the most ironclad rules in American politics is that the president’s party loses ground in midterm elections.”
America has long been a centrist country. Maybe that’s why voters routinely change their minds about how much power they want concentrated in one party’s hands.
Or, maybe the midterm swing has more to do with politicians’ tendency to overpromise on the election trail and underdeliver upon assuming office.
When my younger brother was in high school, he got to interview the oldest living American—who was 112 at the time. When he asked the gentleman if there were any consistent themes he noticed over his extraordinarily long life, his snarky response was, “All the politicians—from both parties—just tell you want you want to hear.”
Can’t argue with that.
Per RealClearPolitics, President Biden’s approval rating is currently hovering around 42%. If that sticks into November, history says it doesn’t bode well for Democrats’ chances in the House of Representatives.
“The president’s standing customarily is critical to his party’s fortunes in midterms,” according to Langer Research. “Each election has its own dynamic. But in midterm elections since 1946, when a president has had more than 50 percent job approval, his party has lost an average of 14 seats. When the president’s approval has been less than 50 percent—as Biden’s is by a considerable margin now—his party has lost an average of 37 seats.”
***
There is always a chance 2022 bucks the historical trend described above. After all, there is no shortage of macro concerns right now.
Inflation is obviously too high. The Federal Reserve was clearly behind the curve in taming budding inflation pressures last year, and many investors now worry the Fed is raising interest rates with reckless abandon.
In other words, earning positive returns between November 2022 and November 2023 isn’t assured.
That said, there is pervasive bearish sentiment now, and the midterm election cycle has one of the most compelling track records on Wall Street. Investors ought to consider that before abandoning solid long-term investments.
* Originally published by Forbes. Reprinted with permission.
This material is not intended to be relied upon as a forecast, research or investment advice. The opinions expressed are as of the date indicated and may change as subsequent conditions vary. The information and opinions contained in this post are derived from proprietary and nonproprietary sources deemed by Silverlight Asset Management LLC to be reliable, are not necessarily all-inclusive and are not guaranteed as to accuracy. As such, no warranty of accuracy or reliability is given and no responsibility arising in any other way for errors and omissions (including responsibility to any person by reason of negligence) is accepted by Silverlight Asset Management LLC, its officers, employees or agents. This post may contain “forward-looking” information that is not purely historical in nature. Such information may include, among other things, projections and forecasts. There is no guarantee that any of these views will come to pass. Reliance upon information in this post is at the sole discretion of the reader.

