The S&P 500 Is The Most Popular And Overpriced Benchmark In The World
Submitted by Silverlight Asset Management, LLC on February 20th, 2023
Almost everyone is invested in the S&P 500 index, which may present a problem.
According to ETF.com, there are 2,205 exchange traded funds (ETFs) currently trading in the US market. The largest is the SPDR S&P 500 ETF (SPY) with approximately $359 billion in assets. Among the top ten equity ETFs, the top three are all S&P 500 index passive funds.

If we break down the relative shares, SPY, IVV, and VOO alone represent 53% of the overall pie.
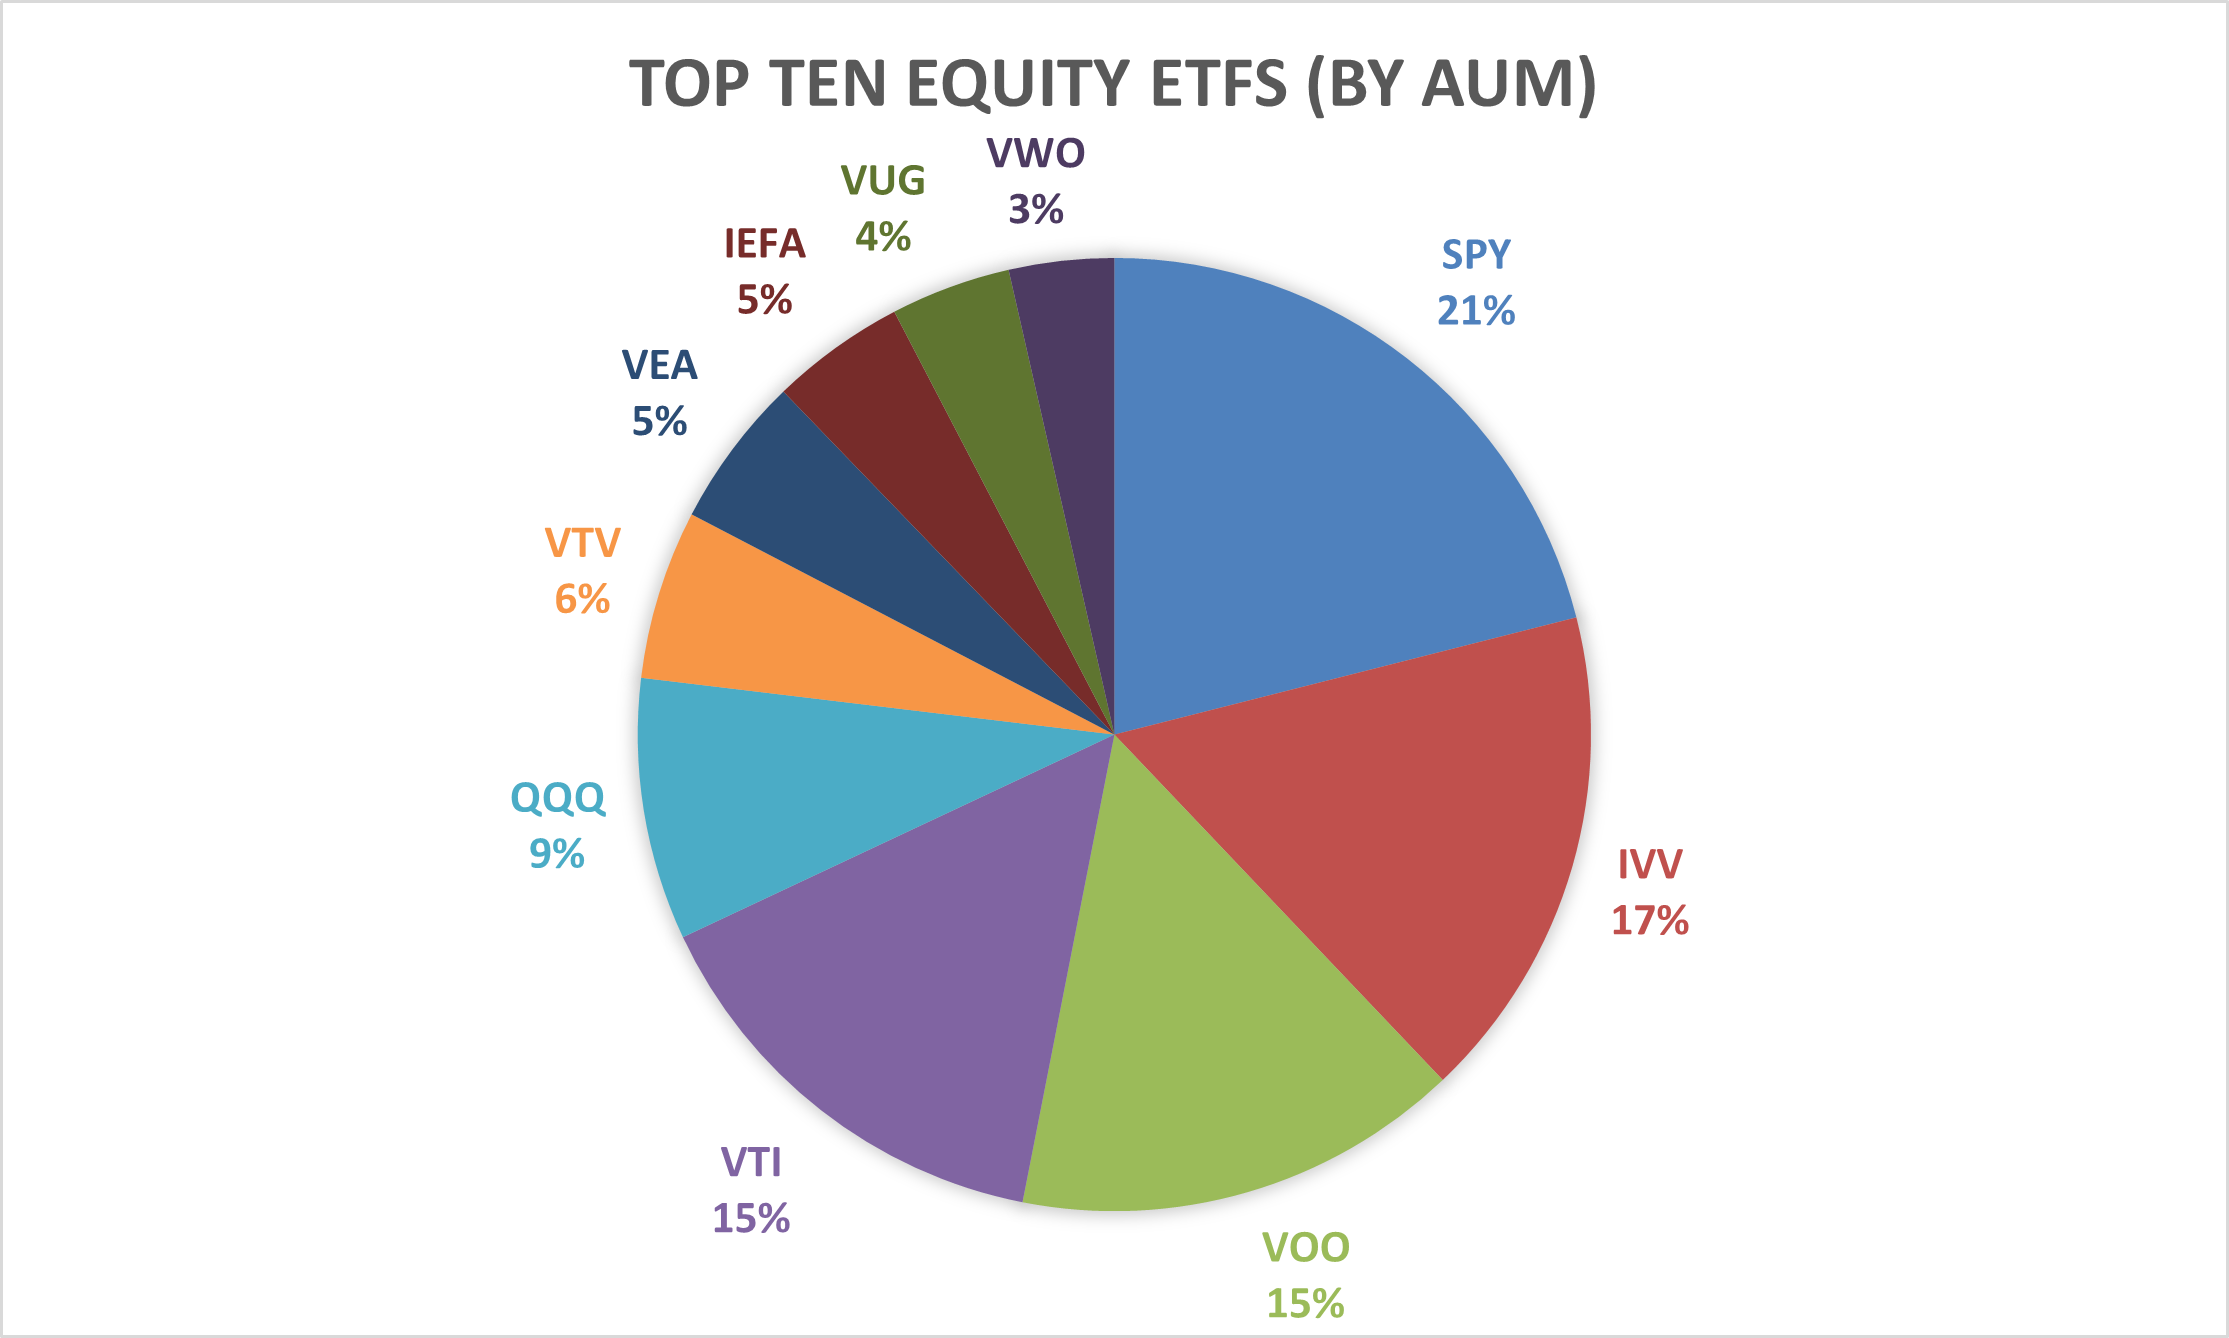
Based on the these figures, the S&P 500 is clearly a very popular investment. But does that also make it risky?
Two investing bubbles are currently inflating the S&P 500’s valuation beyond most comparable benchmarks, and they are a biproduct of ODTE options and passive investing.
#1: The ODTE Options Bubble
The ‘ODTE’ options mania that has transfixed Wall Street is a short-term trend that’s influencing the S&P 500’s valuation.
On February 2, more call options were traded than ever before. This is largely due to an explosion in the number of traders using zero days to expiration, or ODTE options.
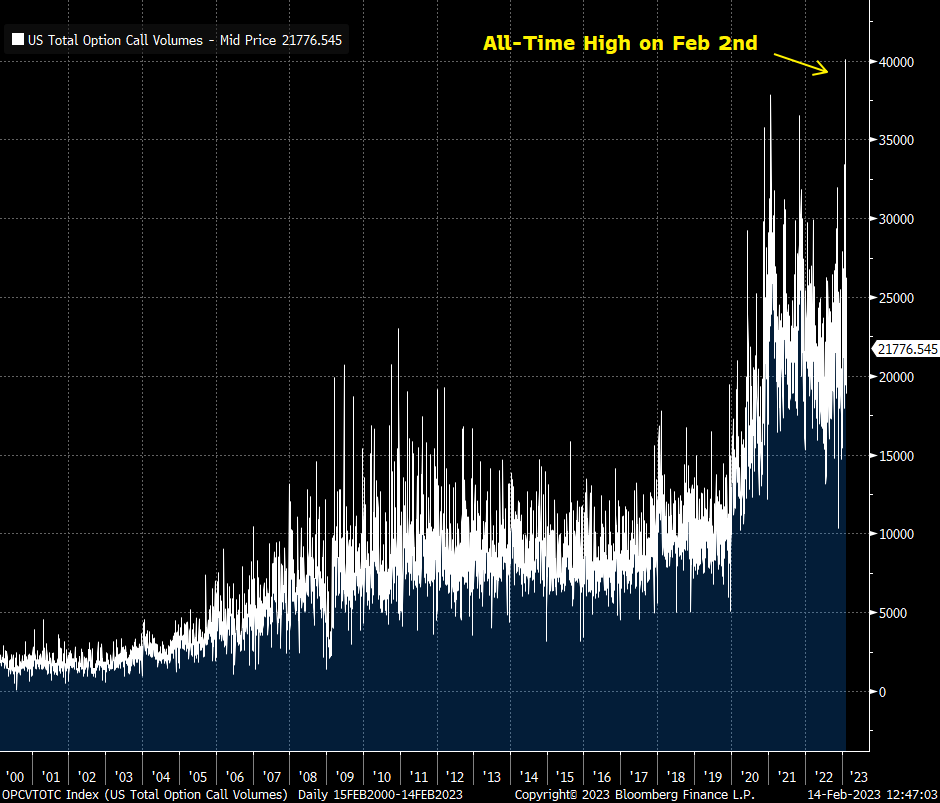
Zero Days to Expiration (ODTE) options are options contracts that expire on the same day they are traded, and they are more commonly used to gain exposure to equities or ETFs with high liquidity. Day traders use such options to make short-term bets on the movement of the underlying assets, with the potential to generate quick profits.
According to Charlie McElligott of Nomura, some financial firms are behaving like “full-tilt day traders”, using options plays to “amplify and ‘juice’ the intended directional market move”.
When options activity accelerates, market makers must scramble to buy and sell shares in the underlying assets to properly hedge their books and keep a market neutral stance. This activity can impact the prices of the assets underlying the options.
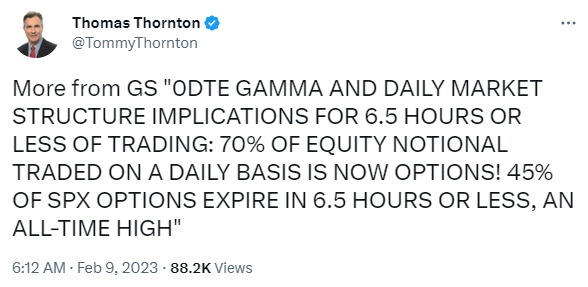
For perspective, market analyst Thomas Thornton posted this tweet last week:
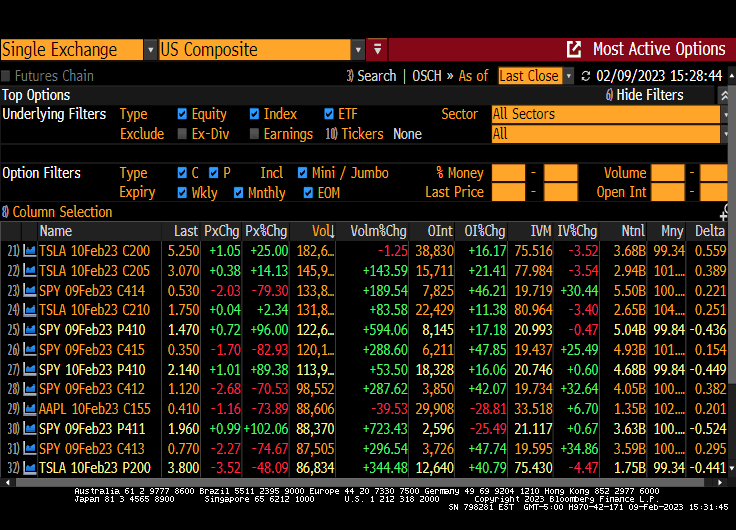
One of the first Bloomberg screens I look at every morning is the Most Active Options dashboard. Apple, Tesla and S&P 500 options frequently appear near the top. Below is a snapshot from a few days ago, when a large number of Tesla, Apple and S&P 500 call options were traded, representing billions of dollars in notional value.
Year to date, the S&P 500 is up 7.9%, while Tesla and Apple shares are +70% and +18%, respectively. The torrid start for these ODTE darlings is almost entirely due to a valuation lift—not a positive shift in fundamentals.
#2: The Passive Investing Bubble
The passive bubble is a long-term trend that’s also inflating the S&P 500’s valuation.
S&P 500 index funds dominate fund flows largely due to a broader shift in how investors allocate capital. In 2013, 34% of domestic equity funds were invested passively (mutual funds and ETFs), whereas today that figure stands at 57%.
Many investors choose a passive investing approach, because it is low cost and normally outperforms most active funds. That simple and straightforward value proposition is why passive fund flows have outpaced active for ten years in a row.
But passive investing isn’t perfect.
One knock against passive investing is how passive it is. If you stop and really think about it, it’s an incredibly lazy form of analysis. Most passive funds are market capitalization driven, which means they just automatically buy the biggest, most valuable companies in whatever their coverage universe is. That’s it.
Passive funds don’t typically consider how much profit a company earns, or whether its shares trade at a nosebleed valuation. If a stock went up a lot in the past, that’s good enough—we can stop the interview right there.
Since bigger is generally better in this increasingly passive investing world, it’s probably no coincidence that size has been a key driver of performance trends over recent years. In the last decade, while passive went from being 34% of domestic funds to 57%, the S&P 500 large cap index most favored by passive investors outperformed smaller cap indices. Since 2013, the S&P 500 has returned 13.2% annually, compared to a 11.7% return for the S&P 400 midcap index, and a 10.0% return for the Russell 2000 small cap index.
Over that time, much of the S&P 500’s outperformance came from its relative valuation re-rating.
Currently, the S&P 500 trades at a price-to-sales ratio (PSR) of 2.4 compared to a 1.3 PSR for the S&P 400 and a 1.2 PSR for the Russell 2000 index. The S&P 500’s PSR multiple was 1.4 in 2013; similar to the other two indices. Since then, however, the S&P 500’s valuation has inflated by 70%, compared to only about a 13% rise in the valuations of the smaller indices.
If we compare the S&P 500 to a foreign benchmark, like the MSCI All Country World ex-US index (ACWX), we find more evidence of an inflated valuation. According to JPMorgan, the 20-year average P/E for the S&P 500 is 15.5 whereas the index now trades at about 18 times earnings. Meanwhile, the ACWI-ex US index trades around 13 times earnings, which is slightly below its 20-year trailing average.
Bond yields also make the S&P 500 look expensive. Six-month treasury bills currently yield about 5%, the highest since 2007. Meanwhile, the earnings yield for the S&P 500 is presently 5.08%, meaning US equity investors are receiving the smallest risk premium since 2001.
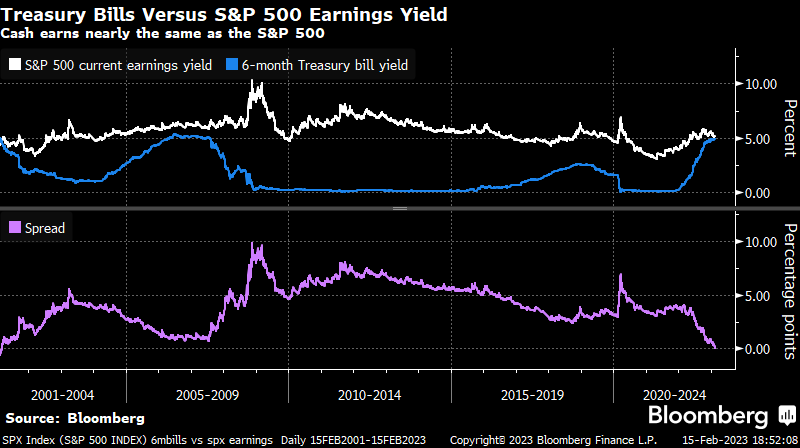
Some of the valuation inflation in the S&P 500 is surely predicated on factors outside of passive or options-driven flows. But make no mistake—those flows matter a lot.
Martin Schmalz is a professor of finance and economics at the University of Oxford who recently published a paper titled, “Index Funds, Asset Prices, and the Welfare of Investors.”
According to Schmalz, “The presence of the index fund tends to increase stock market participation and thus increase asset prices and decrease expected returns from investing in the stock market.”
After building a model and running many simulations, Schmalz found that even though individuals can benefit in the short run by migrating to a lower cost, passive form of investing, wide-scale adoption presents problems, because it drives up the valuation and erodes future return potential.
It’s important to remember that over the long-term, equity market prices are a function of two things: (i) corporate earnings, and (ii) the valuation multiple investors assign to those earnings.
Public companies have long grown their earnings per share (EPS) at a fairly steady pace in the high single-digits. Since 1990, the S&P 500’s EPS has gone up about 7% per year. And over the last ten years, the index has also averaged roughly 7% EPS growth.
If the long run earning power of corporate America is unlikely to change materially, then the driving force that will make some investments work better than others is relative valuation shifts.
Given that the S&P 500 already has the most expensive valuation profile of any major equity benchmark in the world, investors ought to consider diversifying how much active and passive exposure they have in their portfolio going forward.
If the valuation of America’s preferred retirement savings vehicle could inflate in perpetuity, the S&P 500 could perpetually outperform. But if you really think about it, the S&P 500 outperforming in perpetuity is impossible. If that were to occur, the value of companies like Apple would compound to oblivion, eventually swallowing the rest of the economy.
Thus, we should surmise there will eventually be some kind of reckoning for passive investors. Maybe the rapid wealth destruction witnessed in mega cap stocks in 2022 was a sneak preview?
Originally published by Forbes. Reprinted with permission.
This material is not intended to be relied upon as a forecast, research or investment advice. The opinions expressed are as of the date indicated and may change as subsequent conditions vary. The information and opinions contained in this post are derived from proprietary and nonproprietary sources deemed by Silverlight Asset Management LLC to be reliable, are not necessarily all-inclusive and are not guaranteed as to accuracy. As such, no warranty of accuracy or reliability is given and no responsibility arising in any other way for errors and omissions (including responsibility to any person by reason of negligence) is accepted by Silverlight Asset Management LLC, its officers, employees or agents. This post may contain “forward-looking” information that is not purely historical in nature. Such information may include, among other things, projections and forecasts. There is no guarantee that any of these views will come to pass. Reliance upon information in this post is at the sole discretion of the reader.
Testimonials Content Block
More Than an Investment Manager—A Trusted Guide to Financial Growth
"I’ve had the great pleasure of having Michael as my investment manager for the past several years. In fact, he is way more than that. He is a trusted guide who coaches his clients to look first at life’s bigger picture and then align their financial decisions to support where they want to go. Michael and his firm take a unique and personal coaching approach that has really resonated for me and helped me to reflect upon my core values and aspirations throughout my investment journey.
Michael’s focus on guiding the "why" behind my financial decisions has been invaluable to me in helping to create a meaningful strategy that has supported both my short-term goals and my long-term dreams. He listens deeply, responds thoughtfully, and engages in a way that has made my investment decisions intentional and personally empowering. With Michael, it’s not just about numbers—it’s about crafting a story of financial growth that has truly supports the life I want to live."
-Karen W.
Beyond financial guidance!
"As a long-term client of Silverlight, I’ve experienced not only market-beating returns but also invaluable coaching and support. Their guidance goes beyond finances—helping me grow, make smarter decisions, and build a life I truly love. Silverlight isn’t just about wealth management; they’re invested in helping me secure my success & future legacy!"
-Chris B.
All You Need Know to Win
“You likely can’t run a four-minute mile but Michael’s new book parses all you need know to win the workaday retirement race. Readable, authoritative, and thorough, you’ll want to spend a lot more than four minutes with it.”
-Ken Fisher
Founder, Executive Chairman and Co-CIO, Fisher Investments
New York Times Bestselling Author and Global Columnist.
Packed with Investment Wisdom
“The sooner you embark on The Four-Minute Retirement Plan, the sooner you’ll start heading in the right direction. This fun, practical, and thoughtful book is packed with investment wisdom; investors of all ages should read it now.”
-Joel Greenblatt
Managing Principal, Gotham Asset Management;
New York Times bestselling author, The Little Book That Beats the Market
Great Full Cycle Investing
“In order to preserve and protect your pile of hard-earned capital, you need to be coached by pros like Michael. He has both the experience and performance in The Game to prove it. This is a great Full Cycle Investing #process book!”
-Keith McCullough
Chief Executive Officer, Hedgeye Risk Management
Author, Diary of a Hedge Fund Manager
Clear Guidance...Essential Reading
“The Four-Minute Retirement Plan masterfully distills the wisdom and experience Michael acquired through years of highly successful wealth management into a concise and actionable plan that can be implemented by everyone. With its clear guidance, hands-on approach, and empowering message, this book is essential reading for anyone who wants to take control of their finances and secure a prosperous future.”
-Vincent Deluard
Director of Global Macro Strategy, StoneX

