Silverlight Performance Update
Submitted by Silverlight Asset Management, LLC on March 21st, 2024
Key Takeaways:
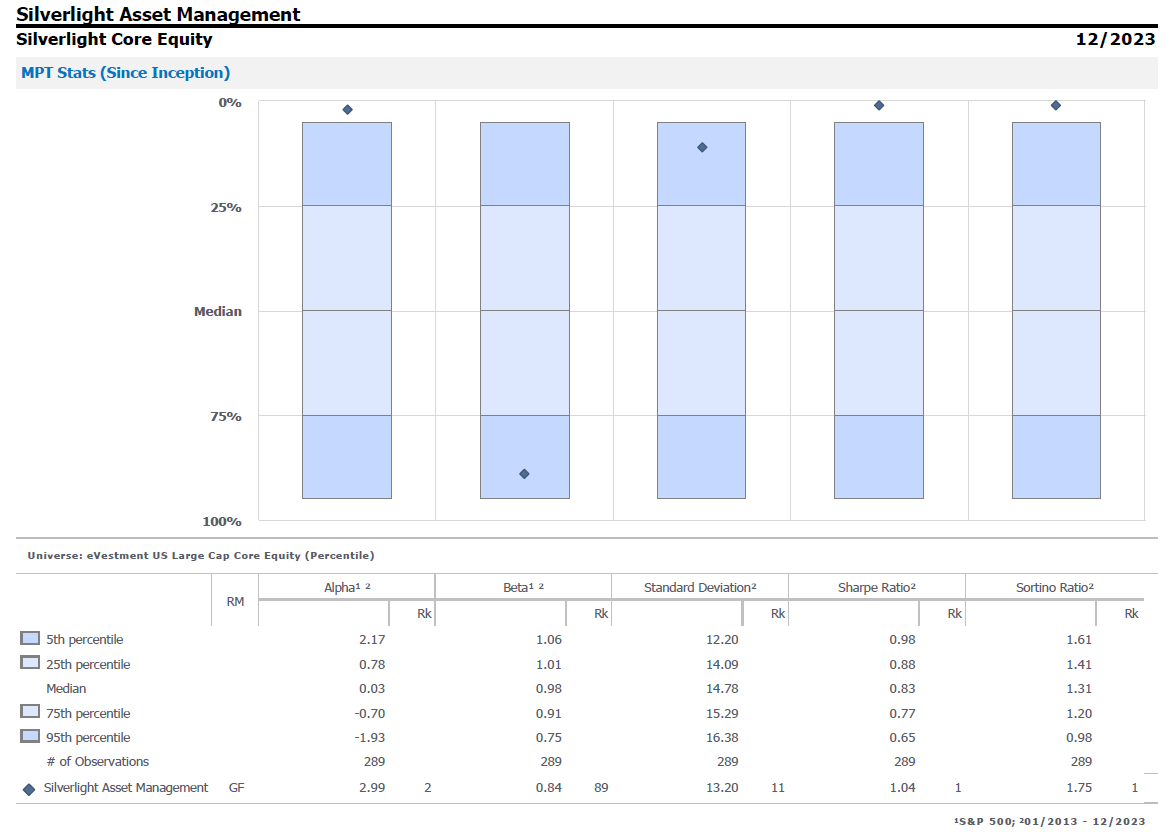
- Silverlight's Core Equity strategy has outperformed the S&P 500 since 2013 and ranks top 1% versus peers
- Silverlight's International Equity strategy has outperformed the ACWI ex-US Index since 2020 and ranks top 1% versus peers
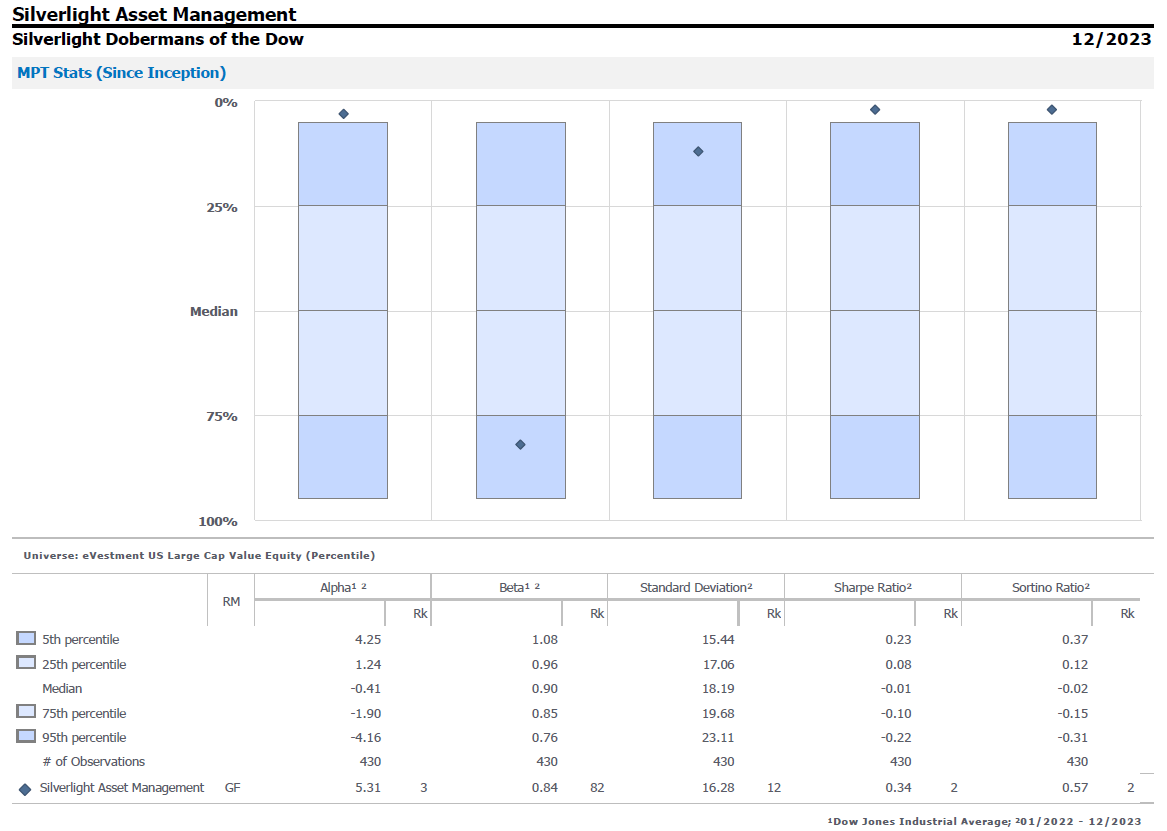
- Silverlight's Dobermans of the Dow strategy has outperformed the Dow Jones Industrial Average since 2022 and ranks top 2% versus peers
Silverlight Asset Management, LLC is unique in that we do our own research, using proprietary tools, to select the individual securities that go into our clients' portfolios. This approach has allowed us to achieve exceptional performance over time across three actively managed strategies: Core Equity, International Equity and the Dobermans of the Dow strategy.
Even though each of these strategies started at different times and pick stocks from different universes, the cumulative results have been similar. Since inception, all three of Silverlight's strategies have outperformed passive and active alternatives on a risk-adjusted basis, which we see as a powerful validation of our investment process.
This post is an annual performance update.
Why Risk-Adjusted Returns Are The Only Measure That Matters
Our investment process has always been designed to help clients effectively compound capital while minimizing risk. "Risk-adjusted returns" is a familiar concept for those who work on Wall Street, but it's a fuzzy concept for people who live on Main Street. I think the best way to explain it is through an example.
Let's say a financial advisor calls up a client and brags about doubling their money over night. The client is ecstatic at first. But when they ask how the advisor accomplished this wonderful feat, the advisor discloses they went to Las Vegas and bet all the client's money on black. How do you think the client would feel after hearing that?
The advisor would probably be immediately fired. That's because the odds of winning with a bet on black at a roulette table are only 47 percent, which is way too much risk to gamble someone's life savings on.
This may be an extreme example, but it also shows why it's hard to properly evaluate returns without also considering the risks that are involved. Thankfully, there are straightforward ways to compare investment returns on a risk-adjusted basis. Metrics we prioritize our investing efforts around include the following:
- Beta is the volatility of a portfolio compared to its benchmark
- Sharpe ratios divide historical returns by the level of overall volatility
- Sortino ratios divide historical returns by the level of downside volatility only, since that's the type of volatility most people try to avoid
With that quick primer out of the way, let's recap how each of Silverlight's strategies have performed.
Silverlight Core Equity
The objective of Silverlight's Core Equity strategy is to achieve long-term capital growth and risk-adjusted returns that exceed the S&P 500 Index.
Since inception in 2013, the Core Equity strategy has produced a 13.71% net annual return compared to 13.75% for the S&P 500 index.
Core Equity has outperformed a conventional passive strategy on a risk-adjusted basis, because even though the long-term net returns are virtually the same, Core Equity clients have enjoyed a smoother ride than the S&P 500 from a volatility perspective.
- Historical beta is only 0.84, which means the strategy has been about 16% less volatile than the benchmark
- Cumulative Sharpe ratio is 0.95 vs. 0.85 for the benchmark
- Cumulative Sortino ratio is 1.59 vs. 1.35 for the benchmark
Core Equity has also outperformed its active strategy peers on a risk-adjusted basis. According to eVestment's institutional database, which tracks and compares thousands of separately managed strategies with similar mandates, Core Equity ranks in the top 1% of its US Large Cap Core Equity universe on both a Sharpe and Sortino ratio basis.

For more information about Silverlight's Core Equity strategy, you can download the following items:
- Silverlight Core Equity Fact Sheet
- Silverlight Core Equity Competitive Analysis
Silverlight International Equity
The objective of Silverlight's International Equity strategy is to achieve long-term capital growth and risk-adjusted returns that exceed the MSCI All Country World (ACWI) ex-US Index.
Since inception in 2020, the International Equity strategy has produced an 7.98% net annual return compared to 3.75% for the ACWI ex-US Index.
International Equity has outperformed a conventional passive strategy on a risk-adjusted basis.
- Historical beta is 0.92, which means the strategy has been about 8% less volatile than the benchmark
- Cumulative Sharpe ratio is 0.34 vs. 0.10 for the benchmark
- Cumulative Sortino ratio is 0.51 vs. 0.15 for the benchmark
International Equity has also outperformed its active strategy peers on a risk-adjusted basis. According to eVestment's institutional database, International Equity ranks in the top 1% of its ACWI-ex US Large Cap Core Equity universe on both a Sharpe and Sortino ratio basis.

For more information about Silverlight's International Equity strategy, you can download the following items:
- Silverlight International Equity Fact Sheet
- Silverlight International Equity Competitive Analysis
Silverlight Dobermans of the Dow
The objective of Silverlight's Dobermans of the Dow strategy is to achieve long-term capital growth and risk-adjusted returns that exceed the Dow Jones Industrial Average.
Since inception in 2022, the Dobermans strategy has produced a 7.86% net annual return compared to 4.02% for the Dow.
The Dobermans of the Dow has outperformed a conventional passive strategy on a risk-adjusted basis.
- Historical beta is 0.83, which means the strategy has been about 17% less volatile than the benchmark
- Cumulative Sharpe ratio is 0.28 vs. 0.04 for the benchmark
- Cumulative Sortino ratio is 0.45 vs. 0.06 for the benchmark
The Dobermans of the Dow strategy has also outperformed its active strategy peers on a risk-adjusted basis. According to eVestment's institutional database, the strategy ranks in the top 2% of its US Large Cap Value Equity universe on both a Sharpe and Sortino ratio basis.

For more information about Silverlight's Dobermans of the Dow strategy, you can download the following items:
- Silverlight Dobermans of the Dow Fact Sheet
- Silverlight Dobermans of the Dow Competitive Analysis
In summary, past performance never guarantees any future result. Markets are always changing, so investors must continually adapt to stay ahead of the curve.
Many of the most fundamental aspects of Silverlight's investment process have stayed the same since the Core Equity strategy originally launched in 2013. But we also try to stay open-minded for ways to upgrade our analytical tools and perspective about markets. In recent years, the biggest change has been to incorporate flow signals to improve our entry and exit timing, with a particular focus on the mega-cap stocks that are most influenced by passive investment flows.
Many financial advisors nowadays act as middlemen who indirectly distribute either passive investments or under-performing active funds. These advisors, and the firms they work for, are at risk of becoming commoditized and left out in the cold. Their distribution model has multiple layers of fees that don't add incremental value. Consumers of financial services are becoming smarter by the day, and many can spot a hollow value proposition when they see it.
Silverlight offers clients a uniquely attractive value proposition: actively managed investment strategies that have outperformed and can be accessed directly in separate account form.
If you have any questions about your portfolio or the strategies mentioned in this post, please reach out anytime.
Disclosure: This material is not intended to be relied upon as a forecast, research or investment advice. The opinions expressed are as of the date indicated and may change as subsequent conditions vary. The information and opinions contained in this post are derived from proprietary and non-proprietary sources deemed by Silverlight Asset Management LLC to be reliable, are not necessarily all-inclusive and are not guaranteed as to accuracy. As such, no warranty of accuracy or reliability is given and no responsibility arising in any other way for errors and omissions (including responsibility to any person by reason of negligence) is accepted by Silverlight Asset Management LLC, its officers, employees or agents. This post may contain “forward-looking” information that is not purely historical in nature. Such information may include, among other things, projections and forecasts. There is no guarantee that any of these views will come to pass. Reliance upon information in this post is at the sole discretion of the reader.
Testimonials Content Block
More Than an Investment Manager—A Trusted Guide to Financial Growth
"I’ve had the great pleasure of having Michael as my investment manager for the past several years. In fact, he is way more than that. He is a trusted guide who coaches his clients to look first at life’s bigger picture and then align their financial decisions to support where they want to go. Michael and his firm take a unique and personal coaching approach that has really resonated for me and helped me to reflect upon my core values and aspirations throughout my investment journey.
Michael’s focus on guiding the "why" behind my financial decisions has been invaluable to me in helping to create a meaningful strategy that has supported both my short-term goals and my long-term dreams. He listens deeply, responds thoughtfully, and engages in a way that has made my investment decisions intentional and personally empowering. With Michael, it’s not just about numbers—it’s about crafting a story of financial growth that has truly supports the life I want to live."
-Karen W.
Beyond financial guidance!
"As a long-term client of Silverlight, I’ve experienced not only market-beating returns but also invaluable coaching and support. Their guidance goes beyond finances—helping me grow, make smarter decisions, and build a life I truly love. Silverlight isn’t just about wealth management; they’re invested in helping me secure my success & future legacy!"
-Chris B.
All You Need Know to Win
“You likely can’t run a four-minute mile but Michael’s new book parses all you need know to win the workaday retirement race. Readable, authoritative, and thorough, you’ll want to spend a lot more than four minutes with it.”
-Ken Fisher
Founder, Executive Chairman and Co-CIO, Fisher Investments
New York Times Bestselling Author and Global Columnist.
Packed with Investment Wisdom
“The sooner you embark on The Four-Minute Retirement Plan, the sooner you’ll start heading in the right direction. This fun, practical, and thoughtful book is packed with investment wisdom; investors of all ages should read it now.”
-Joel Greenblatt
Managing Principal, Gotham Asset Management;
New York Times bestselling author, The Little Book That Beats the Market
Great Full Cycle Investing
“In order to preserve and protect your pile of hard-earned capital, you need to be coached by pros like Michael. He has both the experience and performance in The Game to prove it. This is a great Full Cycle Investing #process book!”
-Keith McCullough
Chief Executive Officer, Hedgeye Risk Management
Author, Diary of a Hedge Fund Manager
Clear Guidance...Essential Reading
“The Four-Minute Retirement Plan masterfully distills the wisdom and experience Michael acquired through years of highly successful wealth management into a concise and actionable plan that can be implemented by everyone. With its clear guidance, hands-on approach, and empowering message, this book is essential reading for anyone who wants to take control of their finances and secure a prosperous future.”
-Vincent Deluard
Director of Global Macro Strategy, StoneX

