Hedging Economic Daybreak
Submitted by Silverlight Asset Management, LLC on January 29th, 2018
You know the day destroys the night,
Night divides the day,
Tried to run —
Tried to hide —
Break on through to the other side!
“Break on Through (To the Other Side)”, The Doors, 1967.
***
There is a lot of buzz lately about bonds entering a bear market. If that proves correct, it marks a major paradigm shift.
A bond bear market likely means a sustained rise in inflation, which means we are finally breaking through—achieving economic ‘escape velocity’. Daybreak in the form of reflation. It means the long, cold night we so feared at the beginning of the cycle—deflation—is no longer a threat.
Are we really on the other side of the deflation risk, though? Or, might a levitating stock market be creating detachment from economic reality—like psychedelic illusions that once transfixed the mind of The Doors front man, Jim Morrison?
Here are three reasons I’m not yet ready to sell all my clients’ bonds, and bid adieu to the risk of deflation.
Reason #1: Bond yields have not decisively broken out
Subjective opinions are like air in markets—they’re all around us. Price action consolidates these opinions, and acts as the arbiter of truth.
Lately, inflation hasn’t been too hot or too cold. Markets like that setup. Don’t interpret inflation as being static in nature, though. Prices are always rising or falling.
Bonds are very sensitive to inflation’s trajectory. If the reflation theme is real, bond prices should fall, pushing yields higher.
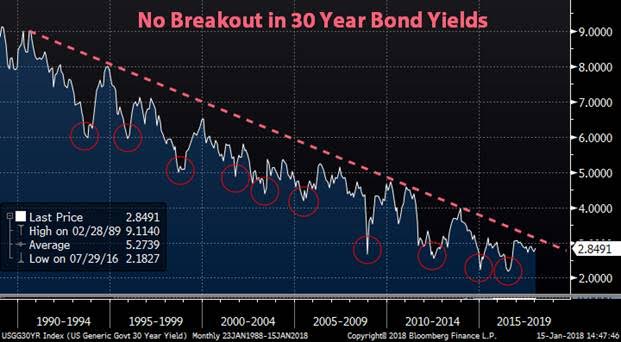
Below is a chart of 30-year bond yields. Does this look like a bull market to you?

For me, yields on the long end of the curve must convincingly break above the trend line and form a solid base (i.e. higher high and higher low) for the bond bear thesis to resonate.
Reason #2: The economic recovery remains a ‘show me story’
Enthusiasm is percolating across the financial landscape.
At 4.1%, unemployment is at the lowest level in 17 years. Meanwhile, consumer confidence and manufacturing surveys are near cycle highs. Economists are nudging GDP forecasts higher. Profit estimates for firms in the S&P 500 Index surged 3.5% over the last four weeks; the biggest jump in six years according to Bloomberg.
Present trends are encouraging. There’s no denying that.
Yet, it’s also important to take a step back and remember what cycle we’re talking about. This cycle is like the tall, skinny kid on a basketball team who needs to hit the weight room. At 34 quarters and counting, it’s long, but it’s not very strong. The annualized growth rate of 2.0% is the weakest since WWII.

Of course, past is not always prologue. Throughout most of this cycle, businesses have been reluctant to make long-term investments. That’s changing though. Surveys indicate CEOs are feeling better about the current policy approach in Washington, and business prospects abroad. Capital spending rose at an annualized rate of 6.2% through Q3 last year, and recent tax cuts may provide additional ammo for capital reinvestment.
Such positive momentum indicates recession is not likely near-term.
However, whether the pace of growth ultimately matches investors’ expectations matters as well. Citi’s Economic Surprise Index reached a five-year high in December and has since peaked. I wrote a column early last month profiling the index and its mean reverting tendency. There have only been five times since 2003 when the index peaked above 75, as it recently did. From those prior peaks to the next corresponding troughs, 10-year bond yields fell on average by 1.1% over the next seven months (source: Canaccord Research).
Thus far, bonds have not reacted much. If data continues to disappoint that may soon change.
Reason #3: Monetary policy uncertainty
Investors are feeling very comfortable about monetary policy.
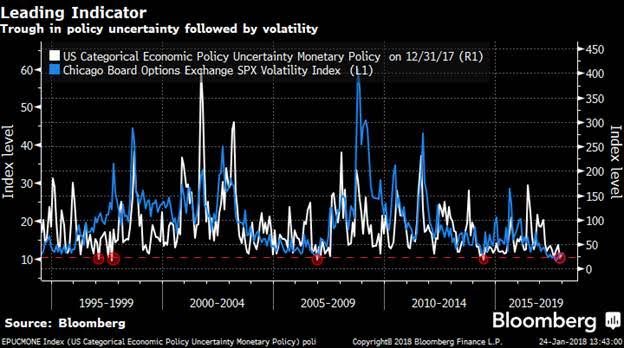
The Monetary Policy Uncertainty index uses news articles to measure angst pertaining to the Fed’s moves. There have only been four other times when the public was this confident in Fed policy. When a base forms, usually not much lower than the present level, equity market volatility often rises in tandem.

The current level of complacency regarding Fed policy strikes me as odd. There are a lot of unknowns to contemplate about the period ahead.
What happens when central banks inject $14 trillion of liquidity into the global fixed income market, and then start to withdraw it?
The truth is, no one really knows. Not Bill Gross, Ray Dalio, Ben Bernanke, Janet Yellen, or the new Fed Chair—Jerome Powell.
A grand monetary policy experiment transpired via the QE programs. The final chapters of this story are not yet written.
There is a lot of evidence suggesting QE has impacted markets. To what extent is debatable. But history says negative interest rates on bonds, like we’ve seen this cycle, are not normal. Nor is it normal to see European corporate bonds trade at an equivalent yield to U.S. treasuries.
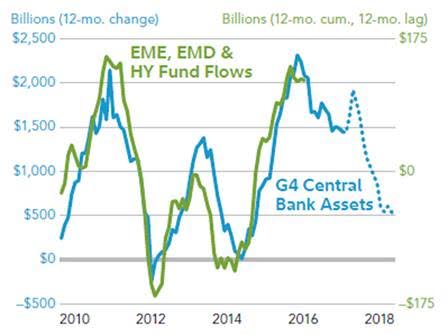
Risk assets across the board have been influenced by central banks policies. One example is reflected in the graph below, courtesy of Fidelity. It shows the projected path of the G4 Central Banks combined balance sheet in rate of change terms (blue line), overlaid against emerging market stocks and bonds (green line). If the correlation holds, it implies EM assets may face a bumpier ride.

Bottom-line: Many investors are using conventional cycle playbooks to navigate what has been an unconventional cycle, born from unconventional policies. If the cycle began in a unique fashion, might it end similarly? If you think the answer may be yes, you ought to consider adding some deflation protection to your portfolio. This type of insurance is relatively cheap right now.
***
Originally published by RealClearMarkets. Reprinted with permission.
This material is not intended to be relied upon as a forecast, research or investment advice, and is not a recommendation, offer or solicitation to buy or sell any securities or to adopt any investment strategy. The opinions expressed are as of the date indicated and may change as subsequent conditions vary. The information and opinions contained in this post are derived from proprietary and nonproprietary sources deemed by Silverlight Asset Management LLC to be reliable, are not necessarily all-inclusive and are not guaranteed as to accuracy. As such, no warranty of accuracy or reliability is given and no responsibility arising in any other way for errors and omissions (including responsibility to any person by reason of negligence) is accepted by Silverlight Asset Management LLC, its officers, employees or agents. This post may contain “forward-looking” information that is not purely historical in nature. Such information may include, among other things, projections and forecasts. There is no guarantee that any of these views will come to pass. Reliance upon information in this post is at the sole discretion of the reader.
Testimonials Content Block
More Than an Investment Manager—A Trusted Guide to Financial Growth
"I’ve had the great pleasure of having Michael as my investment manager for the past several years. In fact, he is way more than that. He is a trusted guide who coaches his clients to look first at life’s bigger picture and then align their financial decisions to support where they want to go. Michael and his firm take a unique and personal coaching approach that has really resonated for me and helped me to reflect upon my core values and aspirations throughout my investment journey.
Michael’s focus on guiding the "why" behind my financial decisions has been invaluable to me in helping to create a meaningful strategy that has supported both my short-term goals and my long-term dreams. He listens deeply, responds thoughtfully, and engages in a way that has made my investment decisions intentional and personally empowering. With Michael, it’s not just about numbers—it’s about crafting a story of financial growth that has truly supports the life I want to live."
-Karen W.
Beyond financial guidance!
"As a long-term client of Silverlight, I’ve experienced not only market-beating returns but also invaluable coaching and support. Their guidance goes beyond finances—helping me grow, make smarter decisions, and build a life I truly love. Silverlight isn’t just about wealth management; they’re invested in helping me secure my success & future legacy!"
-Chris B.
All You Need Know to Win
“You likely can’t run a four-minute mile but Michael’s new book parses all you need know to win the workaday retirement race. Readable, authoritative, and thorough, you’ll want to spend a lot more than four minutes with it.”
-Ken Fisher
Founder, Executive Chairman and Co-CIO, Fisher Investments
New York Times Bestselling Author and Global Columnist.
Packed with Investment Wisdom
“The sooner you embark on The Four-Minute Retirement Plan, the sooner you’ll start heading in the right direction. This fun, practical, and thoughtful book is packed with investment wisdom; investors of all ages should read it now.”
-Joel Greenblatt
Managing Principal, Gotham Asset Management;
New York Times bestselling author, The Little Book That Beats the Market
Great Full Cycle Investing
“In order to preserve and protect your pile of hard-earned capital, you need to be coached by pros like Michael. He has both the experience and performance in The Game to prove it. This is a great Full Cycle Investing #process book!”
-Keith McCullough
Chief Executive Officer, Hedgeye Risk Management
Author, Diary of a Hedge Fund Manager
Clear Guidance...Essential Reading
“The Four-Minute Retirement Plan masterfully distills the wisdom and experience Michael acquired through years of highly successful wealth management into a concise and actionable plan that can be implemented by everyone. With its clear guidance, hands-on approach, and empowering message, this book is essential reading for anyone who wants to take control of their finances and secure a prosperous future.”
-Vincent Deluard
Director of Global Macro Strategy, StoneX

