3 Reasons Fed Tapering Won’t Derail The Equity Bull Market
Submitted by Silverlight Asset Management, LLC on November 8th, 2021
There’s a saying on Wall Street: “The trend is your friend until it ends.” The trend is still up for the US stock market, which just rallied for a fifth consecutive week. The S&P 500 index is up 16 of the last 18 days; a rare streak that last occurred in 1990.
This week’s gains came on the heels of the Federal Reserve finally announcing it is ready to begin winding down its latest QE program. The Fed will taper its current $120 billion monthly buying pace by reducing Treasury purchases by $10 billion a month and mortgage-backed securities by $5 billion.
Even though the announcement was widely expected, some traders were surprised by how easily the market shrugged off the news. Here are three reasons fed tapering will not derail this bull market.
#1: QE Is Not Always Bullish
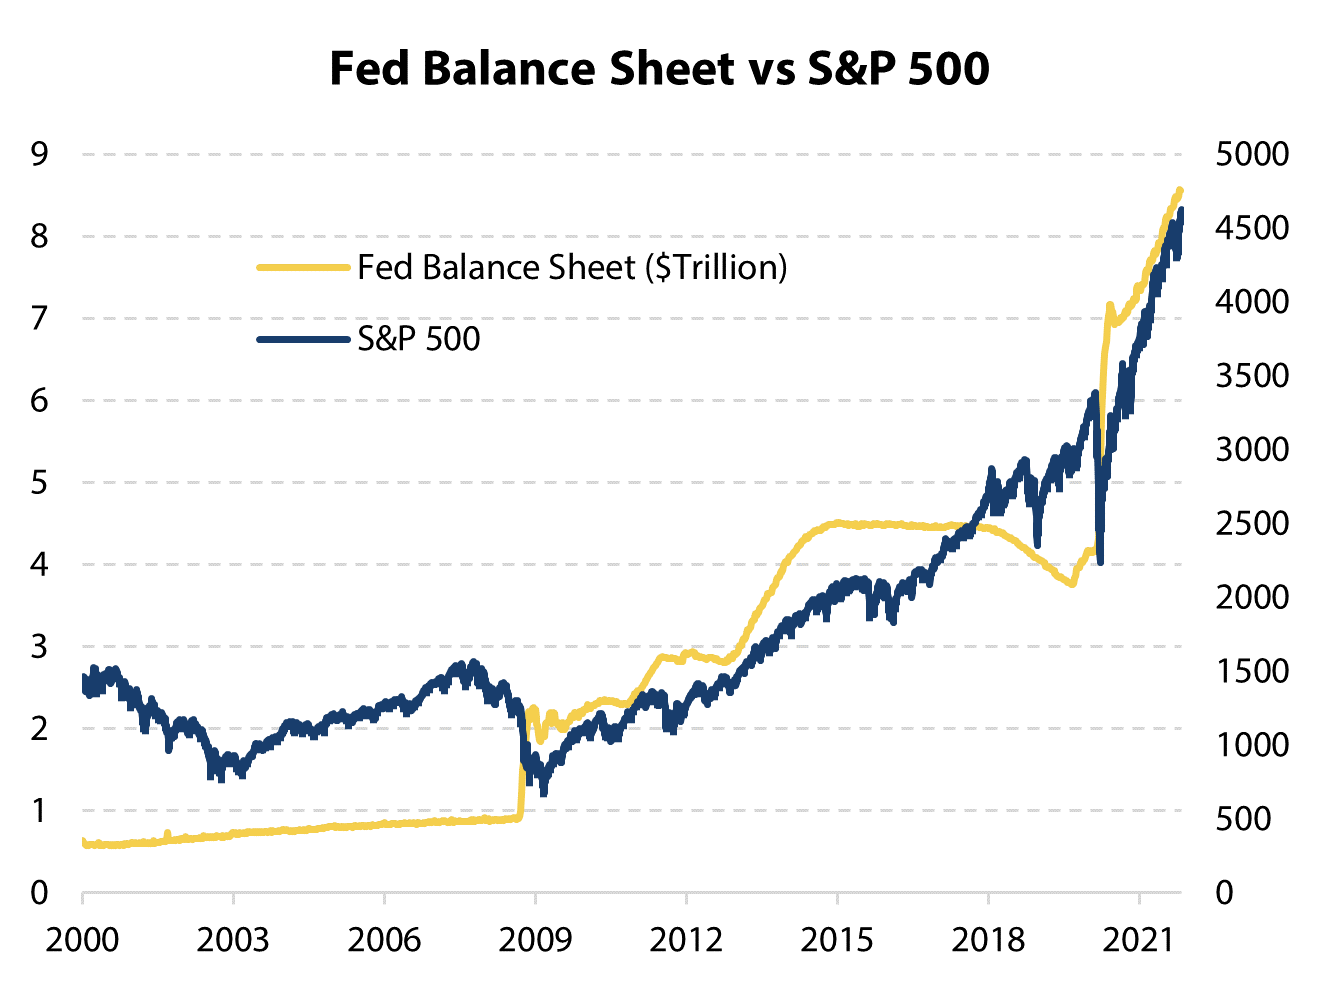
A popular graph that regularly gets shared across the Financial Twittersphere compares the growth of the Fed’s balance sheet to the rise of the S&P 500. You don’t need an MBA or CFA to notice the correlation.
Data Source: Bloomberg
Since 2008, the S&P 500 has performed better when the Fed was expanding its balance sheet. But what if investors are confusing that correlation with causality?
Quantitative easing (QE) is the process of a central bank expanding its balance sheet to purchase assets such as Treasuries and mortgage-backed securities in the open market.
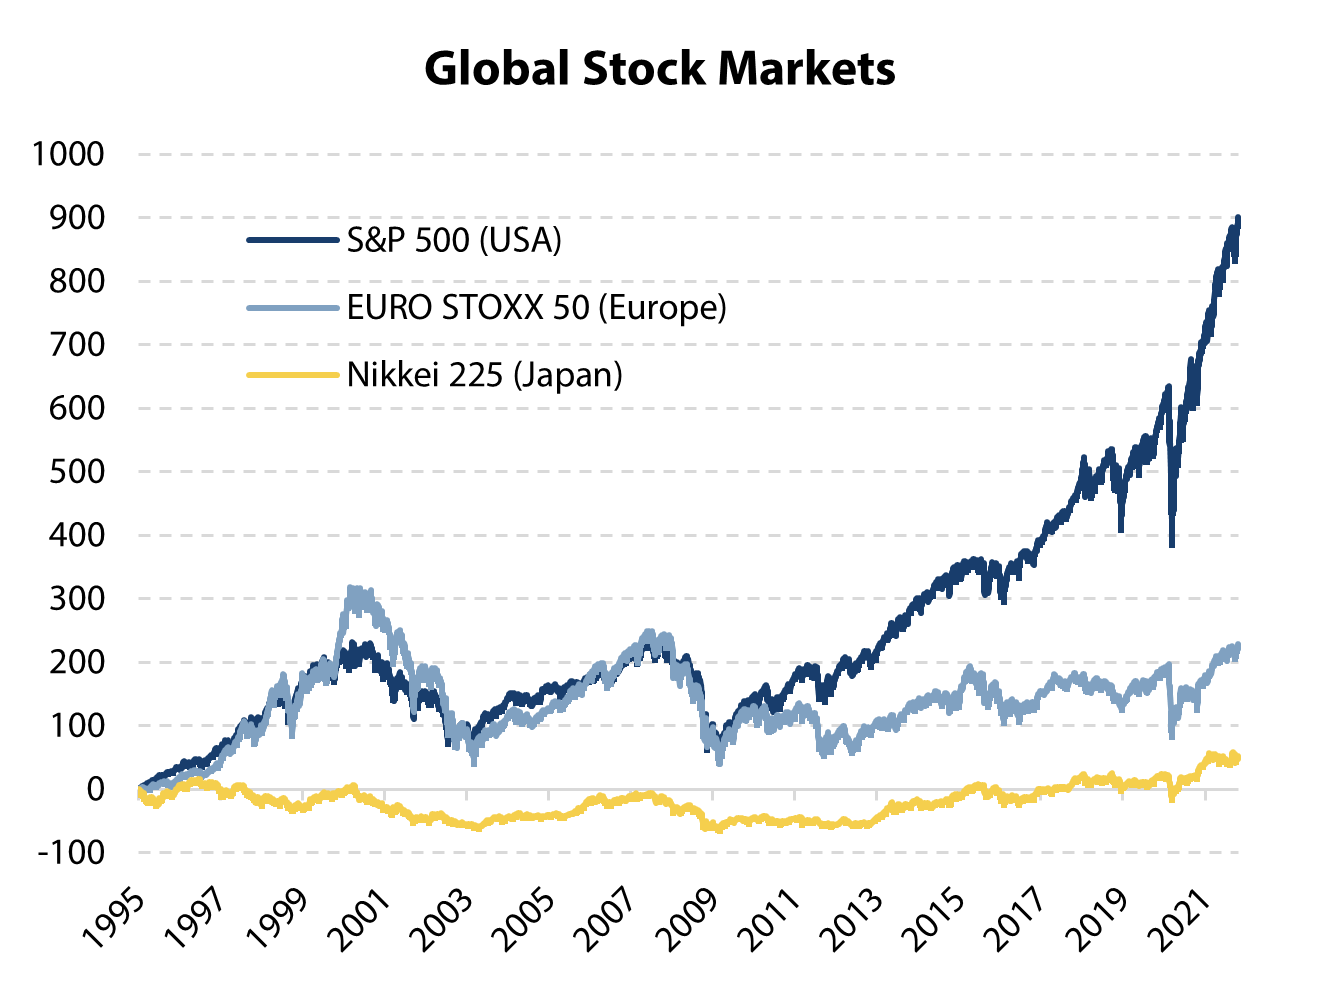
If QE is bullish for stocks, though, why has Japan’s stock market lagged so much? Japan has done more monetary intervention than any country in the developed world. Yet, the Japanese stock market has significantly trailed the US and Europe.
Data Source: Bloomberg
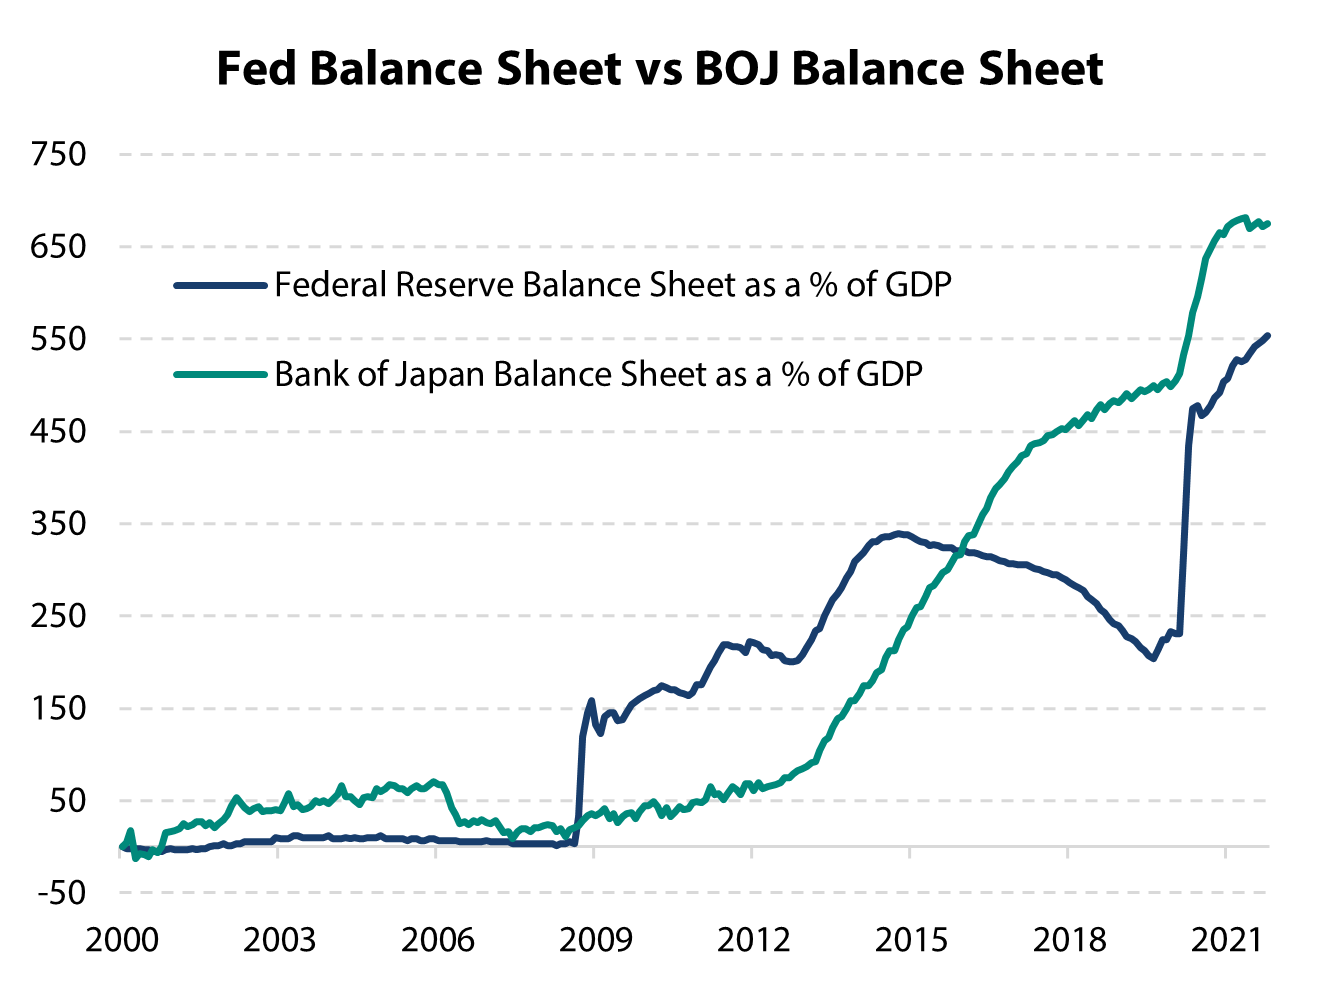
Since 2000, the Bank of Japan (BOJ) has expanded its balance sheet more aggressively than the Federal Reserve.
Data source: Bloomberg
Japan started a QE program that included bond purchases in March 2001. Within two years, the BOJ increased its monetary base by approximately 60%. Since then, the Bank of Japan has expanded its balance sheet at a faster pace than the US central bank. However, this does not appear to have done much to enhance the relative return profile of Japanese equities.
One way to test any macro investing thesis is to think globally. If QE was the main bullish catalyst driving the US stock market, it should have been even more bullish for Japan’s market. But in the words of Gertrude Stein, “There is no there there.”
Hence, there is no reason to believe that QE tapering is necessarily bearish for stocks.
#2: Rates Fell During The Last QE Taper
When the Fed buys bonds, the goal is to stimulate bond prices and suppress yields. Some worry QE tapering will cause interest rates to spike in a harmful way.
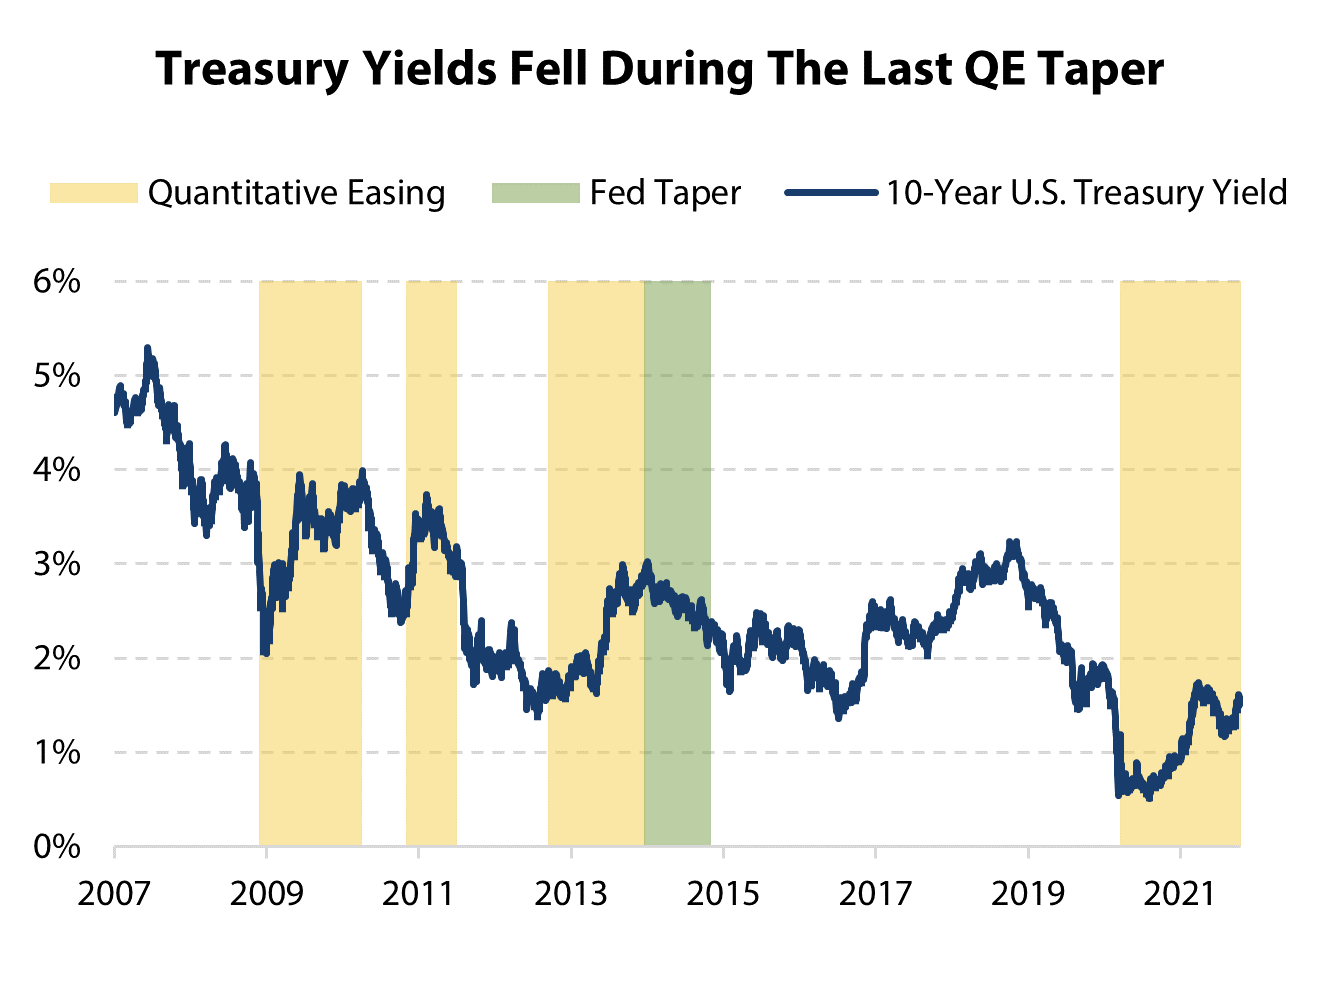
However, it’s important to look at how interest rates have actually behaved when the Fed has done QE or tapered. Contrary to popular perception, yields have risen during past QE episodes, and fallen when the Fed started to taper.
Data Source: Bloomberg
For example, the Fed implemented QE1 from Nov. 25, 2008 to Mar. 31, 2010. During that period, the 10-year Treasury yield rose 72 basis points.
On the other hand, the 10-year Treasury yield fell by 57 basis points when the Fed began to taper at the end of QE3.
If past is prologue, fears about QE tapering leading to much higher interest rates are misplaced.
#3: QE Is Contractionary
Many associate QE with the word “stimulus,” yet there is more evidence to suggest it is contractionary.
QE stymies loan growth by targeting the long end of the yield curve. The spread between short-term and long-term interest rates determines how profitable lending operations are. By shrinking the spread, monetary officials are shrinking the propensity for lenders to lend.
Ken Fisher spelled this out in a column for RealClearMarkets.com. He wrote, “The Fed deployed three huge QE rounds after 2008’s financial crisis. Lending and official money supply growth shriveled. In the five pre-2008 US expansions, loan growth averaged 8.2% y/y. But from the Fed’s first long-term Treasury purchases in March 2009 to December 2013’s initial taper, loan growth averaged just 0.8% y/y. After tapering nixed the nonsense, it accelerated, averaging 5.8% until COVID lockdowns truncated the expansion.”
Japan’s experience with QE is instructive once again. Japanese banks have been stuck in a very long bear market. Since 2000, Japan’s TOPIX Bank Index has returned -44% compared to +74% for the TOPIX Index and + 285% for the MSCI World Index.
Since QE started in the US, banks have underperformed. Meanwhile, there has been a sharp drop in the velocity of money moving through the US financial system.
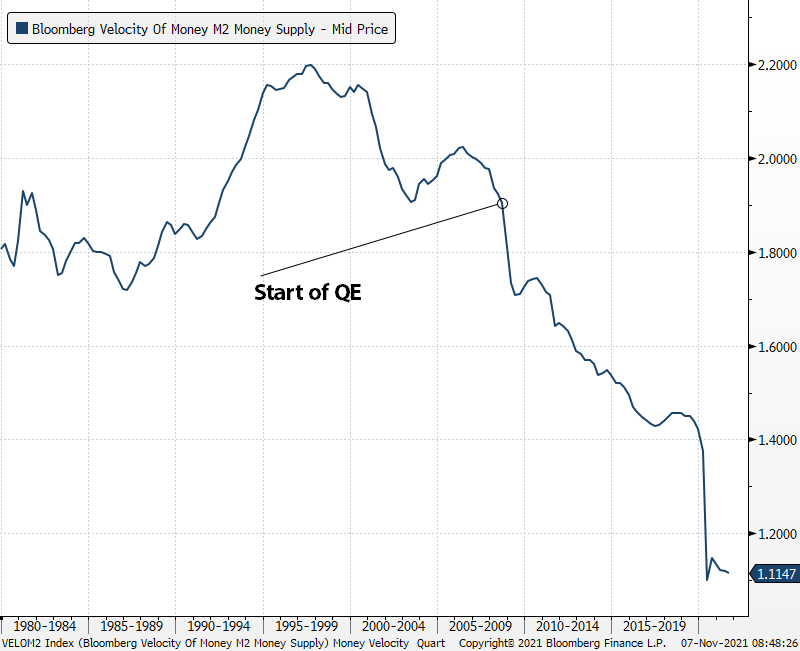
Although bank reserves have increased due to QE, banks haven’t been converting a lot of those excess reserves into new loans the private sector can use for expansion purposes. This is partly why the most recent economic cycle saw the weakest pace of GDP growth since World War II. It was a long cycle, but not particularly strong.
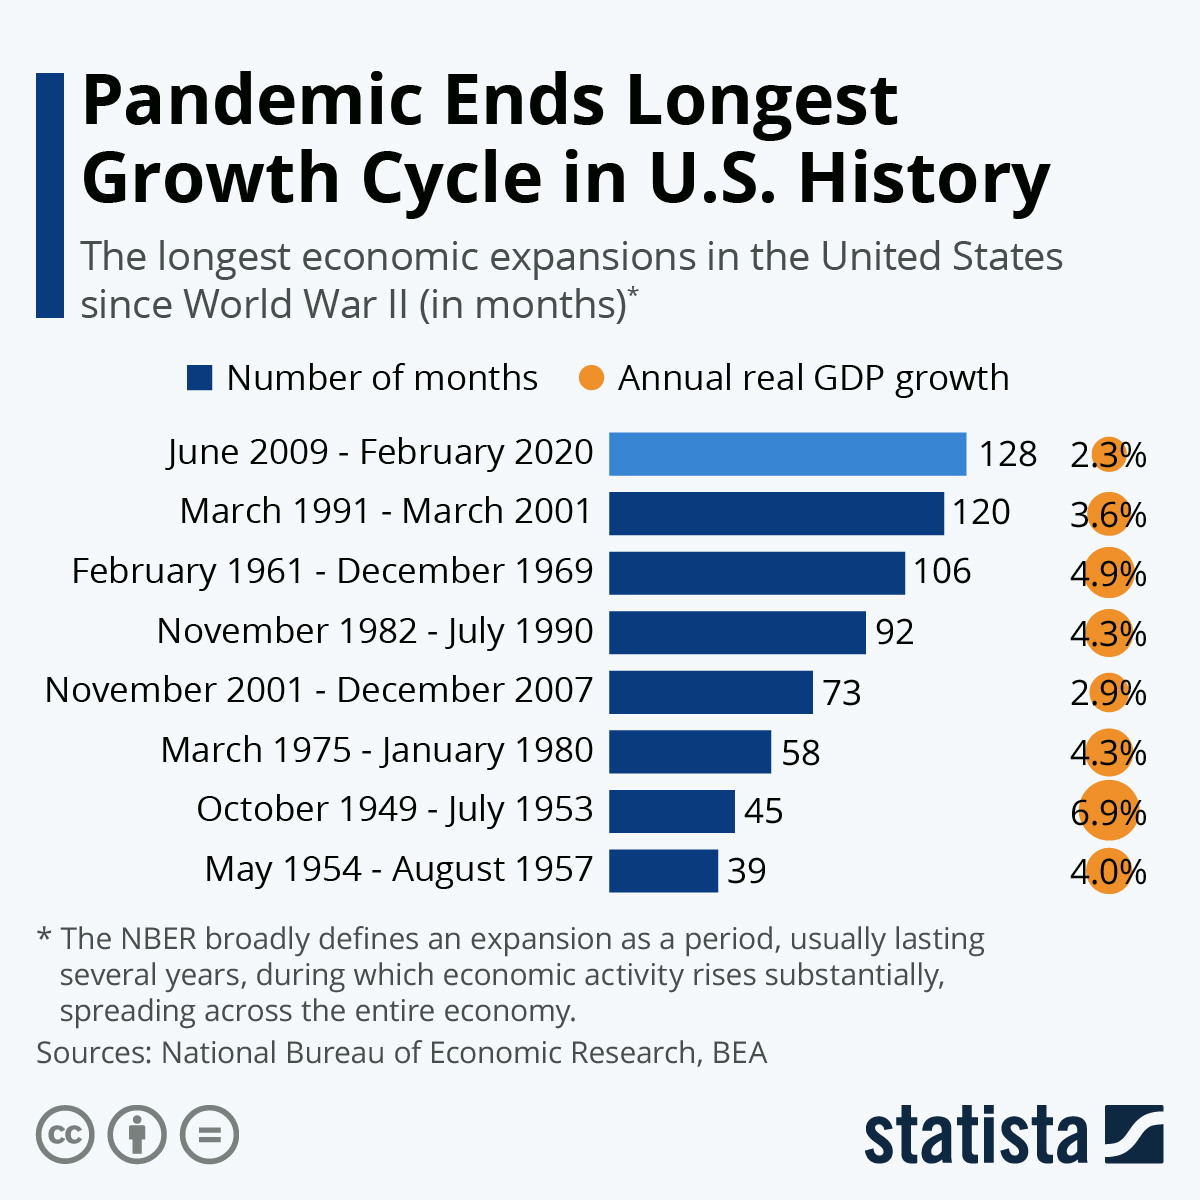
Source: https://www.statista.com/chart/18513/length-of-us-expansions/
QE only played a starring role in one of the last 8 US economic cycles, and that cycle happened to see the weakest growth rate of the bunch. So, doesn’t it seem silly to fret about QE ending?
To be clear, there are legitimate reasons for investors to be cautious right now. QE tapering just isn’t one of them.
Originally published by Forbes.com. Reprinted with permission.
This material is not intended to be relied upon as a forecast, research or investment advice. The opinions expressed are as of the date indicated and may change as subsequent conditions vary. The information and opinions contained in this post are derived from proprietary and nonproprietary sources deemed by Silverlight Asset Management LLC to be reliable, are not necessarily all-inclusive and are not guaranteed as to accuracy. As such, no warranty of accuracy or reliability is given and no responsibility arising in any other way for errors and omissions (including responsibility to any person by reason of negligence) is accepted by Silverlight Asset Management LLC, its officers, employees or agents. This post may contain “forward-looking” information that is not purely historical in nature. Such information may include, among other things, projections and forecasts. There is no guarantee that any of these views will come to pass. Reliance upon information in this post is at the sole discretion of the reader.
Testimonials Content Block
More Than an Investment Manager—A Trusted Guide to Financial Growth
"I’ve had the great pleasure of having Michael as my investment manager for the past several years. In fact, he is way more than that. He is a trusted guide who coaches his clients to look first at life’s bigger picture and then align their financial decisions to support where they want to go. Michael and his firm take a unique and personal coaching approach that has really resonated for me and helped me to reflect upon my core values and aspirations throughout my investment journey.
Michael’s focus on guiding the "why" behind my financial decisions has been invaluable to me in helping to create a meaningful strategy that has supported both my short-term goals and my long-term dreams. He listens deeply, responds thoughtfully, and engages in a way that has made my investment decisions intentional and personally empowering. With Michael, it’s not just about numbers—it’s about crafting a story of financial growth that has truly supports the life I want to live."
-Karen W.
Beyond financial guidance!
"As a long-term client of Silverlight, I’ve experienced not only market-beating returns but also invaluable coaching and support. Their guidance goes beyond finances—helping me grow, make smarter decisions, and build a life I truly love. Silverlight isn’t just about wealth management; they’re invested in helping me secure my success & future legacy!"
-Chris B.
All You Need Know to Win
“You likely can’t run a four-minute mile but Michael’s new book parses all you need know to win the workaday retirement race. Readable, authoritative, and thorough, you’ll want to spend a lot more than four minutes with it.”
-Ken Fisher
Founder, Executive Chairman and Co-CIO, Fisher Investments
New York Times Bestselling Author and Global Columnist.
Packed with Investment Wisdom
“The sooner you embark on The Four-Minute Retirement Plan, the sooner you’ll start heading in the right direction. This fun, practical, and thoughtful book is packed with investment wisdom; investors of all ages should read it now.”
-Joel Greenblatt
Managing Principal, Gotham Asset Management;
New York Times bestselling author, The Little Book That Beats the Market
Great Full Cycle Investing
“In order to preserve and protect your pile of hard-earned capital, you need to be coached by pros like Michael. He has both the experience and performance in The Game to prove it. This is a great Full Cycle Investing #process book!”
-Keith McCullough
Chief Executive Officer, Hedgeye Risk Management
Author, Diary of a Hedge Fund Manager
Clear Guidance...Essential Reading
“The Four-Minute Retirement Plan masterfully distills the wisdom and experience Michael acquired through years of highly successful wealth management into a concise and actionable plan that can be implemented by everyone. With its clear guidance, hands-on approach, and empowering message, this book is essential reading for anyone who wants to take control of their finances and secure a prosperous future.”
-Vincent Deluard
Director of Global Macro Strategy, StoneX

